3. MX-DCM功能
本章介绍MX-DCM的主要功能,以及 mx-dcmi 命令的使用示例。
备注
本文档中,输出结果均以曦云C500为示例。
3.1. 设备查询
用户可以使用设备查询功能查看指定主机上的可用设备。
3.1.1. 使用帮助
mx-dcmi discovery -h
执行命令后,显示如下:
USAGE:
   mx-dcmi discovery [-hlv] [--gpuid <gpuid>] [--host <IP:PORT>]

Where:
   -l, --list <FILE>
      List all GPUs discovered on the host.

   --host <IP:PORT>
      The target host to connect.

   Either of:
      --gpu-id <gpu-id>
         Query target gpu detail info

      --group-id <[0, 63]>
         Query gpus' detail info of a gpu group

   --, --ignore_rest
      Ignores the rest of the labeled arguments following this flag.

   -v, --version
      Displays version information and exits.

   -h, --help
      Displays usage information and exits.

   MetaX Data Center Management Interface
3.1.2. 查看设备列表
mx-dcmi命令:
mx-dcmi discovery --host [IP]:[PORT] -l
操作成功,显示如下:
================== MetaX Data Center Management Interface Log ==================
Timestamp                                              : Wed Nov 5 15:02:00 2025

+----------+--------+----------------------------------------------------------+
| BOARD_ID | GPU ID | Device Information                                       |
+----------+--------+----------------------------------------------------------+
| 0        | 0      | Name: MXC500                                             |
|          |        | PCI Bus ID: 0000:4f:00.0                                 |
|          |        | Device UUID: GPU-dcf2c6b3-bf23-7535-8406-fa0d793df737    |
+----------+--------+----------------------------------------------------------+
| 1        | 1      | Name: MXC500                                             |
|          |        | PCI Bus ID: 0000:50:00.0                                 |
|          |        | Device UUID: GPU-1323796f-71df-ea8c-ed3d-8389dbd9eef4    |
+----------+--------+----------------------------------------------------------+
RESTful API:
curl -i -X GET http://[IP]:[PORT]/api/v1/gpus
操作成功,显示如下:
HTTP/1.1 200 0K
Content-type: application/json
Content-Length: 206

{"gpus":[{"boardid":0,"deviceid":0,"bdfid":"0000:4f:00.0","uuid":"GPU-dcf2c6b3-bf23-7535-8406fa0d793df737","type":"MXC500"},{"boardid":1,"deviceid":1,"bdfid":"0000:50:00.0","uuid":"GPU-1323796f-71df-ea8c-ed3d-8389dbd9eef4","type":"MXC500"}]}
3.1.3. 查看指定设备的属性信息
mx-dcmi命令:
mx-dcmi discovery --host [IP]:[PORT] --gpu-id 0
操作成功,显示如下:
============== MetaX Data Center Management Interface Log ==============
Timestamp                                      : Wed Nov 5 15:00:00 2025

+---------------------------+------------------------------------------+
| BOARD ID: 0               | Power Limit (W): 350                     |
+---------------------------+------------------------------------------+
| GPU ID: 0                 | Device Information                       |
+---------------------------+------------------------------------------+
| Device Name               | MXC500                                   |
| PCI Bus ID                | 0000:4f:00.0                             |
| Device UUID               | GPU-dcf2c6b3-bf23-7535-8406-fa0d793df737 |
| Board SN                  | PBR23090062067                           |
| KMD Version               | 3.3.9                                    |
| VBIOS                     | 1.29.1.0                                 |
+---------------------------+------------------------------------------+
| Shut down Temperature(C)  | 108.00                                   |
| Slow down Temperature(C)  | 95.00                                    |
+---------------------------+------------------------------------------+
RESTful API:
curl -i -X GET http://[IP]:[PORT]/api/v1/gpus/gpu/0
操作成功,显示如下:
HTTP/1.1 200 0K
Content-type: application/json
Content-Length: 256

{"gpus":[{"boardid":0,"deviceid":0,"bdfid":"0000:4f:00.0","uuid":"GPU-dcf2c6b3-bf23-7535-8406fa0d793df737","name":"MXC500","boardSN":"PBR23090062067","kmd":"3.3.9","vbios":"1.29.1.0","shutdownTemperature":"108.0","slowdownTemperature":"95.0","powerLimit":"350"}]}
3.2. 设备分组
在MX-DCM里,几乎所有的设备操作都是以设备组为单位。用户可以创建、删除以及更新设备组,并将设备组用于后续的操作。设备组是为了方便用户对多个设备执行相同的操作。不同的组所包含的设备集合可以有重复,因为不同组可以用于不同的管理需求。
Group 0是默认创建的设备组,包含所有的设备,不可更改。
3.2.1. 使用帮助
mx-dcmi group -h
执行命令后,显示如下:
USAGE:
   mx-dcmi group  [-hlv] [-a <>|-c <>|-d <[0, 63]>|-i|-r <>] [-g <[0, 63]>]
                  [--host <IP:PORT>]
Where:
   -l,  --list
      List all groups.

   --host <IP:PORT>
      The target host to connect.

   -g <[0, 63]>,  --group <[0, 63]>
      Group id

   Either of:
      -a <>,  --add <>
         Add devices to group

      -c <>,  --create <>
         Create a group on the remote host.

      -d <[0, 63]>,  --delete <[0, 63]>
         Delete a group on the remote host.

      -r <>,  --remove <>
         Remove gpus from group


      -i,  --inquiry
         Inquiry group information

   --,  --ignore_rest
      Ignores the rest of the labeled arguments following this flag.

   -v,  --version
      Displays version information and exits.

   -h,  --help
      Displays usage information and exits.

   MetaX Data Center Management Interface
3.2.2. 创建设备组
mx-dcmi命令:
mx-dcmi group --host [IP]:[PORT] -c group1
操作成功,显示如下:
create group group1 with a group ID of 1 successfully
RESTful API:
curl -i -X POST http://[IP]:[PORT]/api/v1/groups/group1
操作成功,显示如下:
HTTP/1.1 200 OK
Content-type: application/json
Content-Length: 13

{"groupid": 1}
3.2.3. 添加设备到设备组
以下命令把gpu#0和gpu#1添加到设备组#1。
mx-dcmi命令:
mx-dcmi group --host [IP]:[PORT] -a 0,1 -g 1
操作成功,显示如下:
add gpus operation successfully
RESTful API:
curl -i -X PUT http://[IP]:[PORT]/api/v1/groups/1/gpu?gpuid=0,1
操作成功,显示如下:
HTTP/1.1 200 0K
Content-Length: 0
3.2.4. 从设备组移除设备
以下命令从设备组#1移除gpu#0。
mx-dcmi命令:
mx-dcmi group --host [IP]:[PORT] -r 0 -g 1
操作成功,显示如下:
remove gpus operation successfully
RESTful API:
curl -i -X DELETE http://[IP]:[PORT]/api/v1/groups/1/gpu?gpuid=0
操作成功,显示如下:
HTTP/1.1 200 0K
Content-Length: 0
3.2.5. 查看设备组列表
mx-dcmi命令:
mx-dcmi group --host [IP]:[PORT] -l
操作成功,显示如下:
============= MetaX Data Center Management Interface Log =============
Timestamp                                  : Fri Nov  21 16:52:49 2025

+--------------------------------------------------------------------+
| GROUPS                                                             |
| 1 groups found                                                     |
+--------------------------------------------------------------------+
+------------+-------------------------------------------------------+
| Group ID   | 0                                                     |
| Group Name | DCM_ALL_SUPPORTED_GPUS                                |
| GPU ID(s)  | 0, 1, 2, 3, 4, 5, 6, 7                                |
+------------+-------------------------------------------------------+
RESTful API:
curl -i -X GET http://[IP]:[PORT]/api/v1/groups
操作成功,显示如下:
HTTP/1.1 200 OK
Content-type: application/json
Content-Length: 86

{"gpugroups":[{"groupid":0,"name":"DCM_ALL_SUPPORTED_GPUS","gpus":[0,1,2,3,4,5,6,7]}]}
3.2.6. 查看设备组详细信息
mx-dcmi命令:
mx-dcmi group --host [IP]:[PORT] -i -g 1
操作成功,显示如下:
============= MetaX Data Center Management Interface Log ===========
Timestamp                                 : Fri Nov  7 17:11:38 2025

+------------+-----------------------------------------------------+
| GROUPS                                                           |
+------------+-----------------------------------------------------+
+------------+-----------------------------------------------------+
| Group ID   | 1                                                   |
| Group Name | group1                                              |
| GPU ID(s)  | 0, 1                                                |
+------------+-----------------------------------------------------+
RESTful API:
curl -i -X GET http://[IP]:[PORT]/api/v1/groups/0
操作成功,显示如下:
HTTP/1.1 200 OK
Content-type: application/json
Content-Length: 70

{"groupid":0,"name":"DCM_ALL_SUPPORTED_GPUS","gpus":[0,1,2,3,4,5,6,7]}
3.2.7. 删除设备组
mx-dcmi命令:
mx-dcmi group --host [IP]:[PORT] -d 1
操作成功,显示如下:
delete group 1 successfully
RESTful API:
curl -i -X DELETE http://[IP]:[PORT]/api/v1/groups/1
操作成功,显示如下:
HTTP/1.1 200 0K
Content-Length: 0
3.3. 指标分组
用户可以管理自定义的指标组,并将指标组用于设备或设备组的状态监控。
FieldGroup 0是默认创建的指标组,不可更改。
3.3.1. 使用帮助
mx-dcmi fieldgroup -h
执行命令后,显示如下:
USAGE:
mx-dcmi fieldgroup [-hv] {-c <groupName>]|-d|-i|-l|--list-fields} [-f
                     <fieldsId>][-g <[0,63]>] [--host <IP:PORT>]
Where:
   --host <IP:PORT>
      The target host to connect.

   -g <[0,63]>, --fieldgroup <[0,63]>
      The field group to query on the remote host.

   -f <fieldsId>, --fields <fieldsId>
      Comma-separated list of field ids to add to a field group when
      creating a new one
      or Query target fields info when listing available fields

   One of:
      -c <groupName>, --create <groupName>
      Create a field group on the remote host.

      -i, --info
      Get a field group info on the remote host.

      -d, --delete
      Delete a field group on the remote host.

      -l, --list
      List all field group.

      --list-fields
      List all available field.

   MetaX Data Center Management Interface
3.3.2. 创建指标组
以下命令创建指标组create_fieldgroup,并添加指标 1, 2, 3, 4, 25。
mx-dcmi命令:
mx-dcmi fieldgroup --host [IP]:[PORT] -c create_fieldgroup -f 1-4,25
操作成功,显示如下:
create field group "create_fieldgroup" with a group ID of 1 successfully
RESTful API:
curl -i -X POST http://[IP]:[PORT]/api/v1/fieldgroups/create_fieldgroup?fields=1-4,25
操作成功,显示如下:
HTTP/1.1 200 0K
Content-type: application/json
Content-Length: 13
{"groupid":1}
3.3.3. 删除指标组
mx-dcmi命令:
mx-dcmi fieldgroup --host [IP]:[PORT] -d -g 1
操作成功,显示如下:
delete field group 1 successfully
RESTful API:
curl -i -X DELETE http://[IP]:[PORT]/api/v1/fieldgroups/1
操作成功,显示如下:
HTTP/1.1 200 0K
Content-Length: 0
3.3.4. 查看指标组信息
mx-dcmi命令:
mx-dcmi fieldgroup --host [IP]:[PORT] -i -g 1
操作成功,显示如下:
============ MetaX Data Center Management Interface Log ==========
Timestamp                                : Wed Nov 5 15:00:00 2025

+----------------------------------------------------------------+
| FIELD GROUP                                                    |
+--------------------+-------------------------------------------+
| Field Group ID     | 1                                         |
| Field Group Name   | create_fieldgroup                         |
| Field ID(s)        | 1, 2, 3, 4, 25                            |
+--------------------+-------------------------------------------+
RESTful API:
curl -i -X GET http://[IP]:[PORT]/api/v1/fieldgroups/1
操作成功,显示如下:
HTTP/1.1 200 0K
Content-type: application/json
Content-Length: 62

{"groupid":1,"name":"create_fieldgroup","fields":{1,2,3,4,25}}
3.3.5. 查看指标组列表
mx-dcmi命令:
mx-dcmi fieldgroup --host [IP]:[PORT] -l
操作成功,显示如下:
=========== MetaX Data Center Management Interface Log ===========
Timestamp                                : Wed Nov 5 15:20:00 2025

+----------------------------------------------------------------+
| FIELD GROUP                                                    |
| 2 field groups found                                           |
+--------------------+-------------------------------------------+
| Field Group ID     | 0                                         |
| Field Group Name   | DEFAULT_FIELD_GROUP                       |
| Field ID(s)        | 11, 13, 23, 24, 25, 31, 32, 33            |
+--------------------+-------------------------------------------+
| Field Group ID     | 1                                         |
| Field Group Name   | create_fieldgroup                         |
| Field ID(s)        | 1, 2, 3, 4, 25                            |
+--------------------+-------------------------------------------+
RESTful API:
curl -i -X GET http://[IP]:[PORT]/api/v1/fieldgroups
操作成功,显示如下:
HTTP/1.1 200 0K
Content-type: application/json
Content-Length: 150

{"fieldgroups":[{"groupid":0,"name":"DEFAULT_FIELD_GROUP","fields":[11,13,23,24,25,31,32,33]},{"groupid":1,"name":"create_fieldgroup","fields":[1,2,3,4,25]}]}
3.3.6. 查看所有可用指标
mx-dcmi命令:
mx-dcmi fieldgroup --host [IP]:[PORT] --list-fields
操作成功,显示如下:
======= MetaX Data Center Management Interface Log ========
Timestamp                         : Wed Nov 5 15:00:00 2025

+----+-----------------------+----+-----------------------+
| Id | Field Name            | Id | Field Name            |
+----------------------------+----+-----------------------+
| 0  | UNKNOWN               | 18 | CCX_CLOCK             |
| 1  | DRIVER_VERSION        | 19 | GPU_TEMP              |
| 2  | VBIOS_VERSION         | 20 | SOC_TEMP              |
| 3  | FW_VERSION            | 21 | TEMP_LIMIT            |
| 4  | SML_VERSION           | 22 | PMBUS_POWER           |
| 5  | PROCESS_NAME          | 23 | BOARD_POWER           |
| 6  | DEV_COUNT             | 24 | GPU_UTIL              |
| 7  | DEV_NAME              | 25 | MEM_UTIL              |
| 8  | DEV_SML_INDEX         | 26 | VPUE_UTIL             |
| 9  | DEV_SERIAL            | 27 | VPUD_UTIL             |
| 10 | DEV_BDFID             | 28 | PCIE_GEN              |
| 11 | GPU_CLOCK             | 29 | PCIE_WIDTH            |
| 12 | CSC_CLOCK             | 30 | PCIE_MAX_GEN          |
| 13 | MC_CLOCK              | 31 | PCIE_TX               |
| 14 | SOC_CLOCK             | 32 | PCIE_RX               |
| 15 | DNOC_CLOCK            | 33 | ECC_STATE             |
| 16 | VPUE_CLOCK            | 34 | MAX_FIELDS            |
| 17 | VPUD_CLOCK            |    |                       |
+----------------------------+----+-----------------------+
RESTful API:
curl -i -X GET http://[IP]:[PORT]/api/v1/fields
操作成功,显示如下:
HTTP/1.1 200 0K
Content-type: application/json
Content-Length: 1008

{"fields":[{"id":0,"name":"UNKNOWN"},{"id":1,"name":"DRIVER_VERSION"},{"id":2,"name":"VBIOS_VERSION"},{"id":3,"name":"FW_VERSION"},{"id":4,"name":"SML_VERSION"},{"id":5,"name":"PROCESS_NAME"},{"id":6,"name":"DEV_COUNT"},{"id":7,"name":"DEV_NAME"},{"id":8,"name":"DEV_SML_INDEX"},{"id":9,"name":"DEV_SERIAL"},{"id":10,"name":"DEV_BDFID"},{"id":11,"name":"GPU_CLOCK"},{"id":12,"name":"CSC_CLOCK"},{"id":13,"name":"MC_CLOCK"},{"id":14,"name":"SOC_CLOCK"},{"id":15,"name":"DNOC_CLOCK"},{"id":16,"name":"VPUE_CLOCK"},{"id":17,"name":"VPUD_CLOCK"},{"id":18,"name":"CCX_CLOCK"},{"id":19,"name":"GPU_TEMP"},{"id":20,"name":"SOC_TEMP"},{"id":21,"name":"TEMP_LIMIT"},{"id":22,"name":"PMBUS_POWER"},{"id":23,"name":"BOARD_POWER"},{"id":24,"name":"GPU_UTIL"},{"id":25,"name":"MEM_UTIL"},{"id":26,"name":"VPUE_UTIL"},{"id":27,"name":"VPUD_UTIL"},{"id":28,"name":"PCIE_GEN"},{"id":29,"name":"PCIE_WIDTH"},{"id":30,"name":"PCIE_MAX_GEN"},{"id":31,"name":"PCIE_TX"},{"id":32,"name":"PCIE_RX"},{"id":33,"name":"ECC_STATE"},{"id":34,"name":"MAX_FIELDS"}]}
指标含义说明参见表 3.1。
指标 |
含义 |
|---|---|
0 |
占位,无实际含义 |
1 |
驱动版本 |
2 |
VBIOS版本 |
3 |
FIRMWARE版本 |
4 |
MXSML版本 |
5 |
进程名称 |
6 |
设备数量 |
7 |
设备名称 |
8 |
设备Index |
9 |
设备序列号 |
10 |
设备BDF ID |
11 |
GPU Clock |
12 |
Central System Control Clock |
13 |
Memory Controller Clock |
14 |
SOC(System on Chip) Clock |
15 |
DNOC(data network on chip) Clock |
16 |
视频处理单元编码Clock |
17 |
视频处理单元解码Clock |
18 |
Core CompleX Clock |
19 |
GPU温度 |
20 |
SOC温度 |
21 |
温度上限,不同型号产品上限不同,如C500为108,C600为110 |
22 |
PMBUS功耗 |
23 |
板卡功耗 |
24 |
设备使用率 |
25 |
显存使用率 |
26 |
视频处理单元编码使用率 |
27 |
视频处理单元解码使用率 |
28 |
PCIe 传输速率 |
29 |
设备支持的 PCIe lanes 数量 |
30 |
PCIe 最大传输速率 |
31 |
PCIe 接口接收吞吐量 |
32 |
PCIe 接口发送吞吐量 |
33 |
设备显存ECC模式 |
34 |
占位,无实际含义 |
3.4. 状态监控
用户可以实时监控设备数据。对于曦云C588和曦索X206,会分Die显示信息。
3.4.1. 使用帮助
mx-dcmi dmon -h
执行命令后,显示如下:
USAGE:
   mx-dcmi dmon  [-hv] [-g <[0, 63]>|-i <gpu-id>] [-e <fieldIds>|-f <[0,
               63]>] [-c <count>] [-d <delay>] [--host <IP:PORT>]
Where:
   --host <IP:PORT>
   The target host to connect.

   -c <count>,  --count <count>
   Integer representing how many times to loop before exiting, 0
   represents forever.

   -d <delay>,  --delay <delay>
   Integer(ms) representing how often to query results from DCMD and
   print them.
   Default: 1000ms, minimum: 1000ms.

   Either of:
      -i <gpu-id>,  --gpu-id <gpu-id>
      Gpu index, run mx-dcmi discovery --host ip:port -l to check list of
      gpu ids.

      -g <[0, 63]>,  --group-id <[0, 63]>
      The gpu group to query on the specified host.

   Either of:
      -e <fieldIds>,  --field-id <fieldIds>
      Field identifier to view/inject.

      -f <[0, 63]>,  --field-group-id <[0, 63]>
      The field group to query on the specified host.

   --,  --ignore_rest
   Ignores the rest of the labeled arguments following this flag.

   -v,  --version
   Displays version information and exits.

   -h,  --help
   Displays usage information and exits.

   MetaX Data Center Management Interface
3.4.2. 开启设备监控
mx-dcmi命令:
mx-dcmi dmon --host [IP]:[PORT] -i 0 -e 11 -d 2000 -c 5
-e(指标)可替换为-f(指标组)。-d(可选参数)指定监控间隔,不指定时默认1s。-c(可选参数)指定监控次数,不指定时持续监控。
操作成功,显示如下:
gpu   die   GPU_CLOCK
id    id    MHz
0     0     428
0     0     428
0     0     428
0     0     428
0     0     428
RESTful API:
curl -i -X GET http://[IP]:[PORT]/api/v1/stats?gpu=0\&fields=11\&delay=2000\&count=5
fields(指标)可替换为fieldgroup(指标组)。delay(可选参数)指定监控间隔,不指定时默认1s。count(可选参数)指定监控次数,不指定时持续监控。
操作成功,显示如下:
HTTP/1.1 200 OK
Content-Type: text/event-stream

{"stats":[{"gpuid":0,"dieid":0,"gpustats":[{"fieldid":11,"fieldname":"GPU_CLOCK","fieldunit":"MHz","value":"428"}]}]}

{"stats":[{"gpuid":0,"dieid":0,"gpustats":[{"fieldid":11,"fieldname":"GPU_CLOCK","fieldunit":"MHz","value":"428"}]}]}

{"stats":[{"gpuid":0,"dieid":0,"gpustats":[{"fieldid":11,"fieldname":"GPU_CLOCK","fieldunit":"MHz","value":"428"}]}]}

{"stats":[{"gpuid":0,"dieid":0,"gpustats":[{"fieldid":11,"fieldname":"GPU_CLOCK","fieldunit":"MHz","value":"428"}]}]}

{"stats":[{"gpuid":0,"dieid":0,"gpustats":[{"fieldid":11,"fieldname":"GPU_CLOCK","fieldunit":"MHz","value":"428"}]}]}
3.4.3. 开启设备组监控
mx-dcmi命令:
mx-dcmi dmon --host [IP]:[PORT] -g 0 -e 11 -d 2000 -c 5
-e(指标)可替换为-f(指标组)。-d(可选参数)指定监控间隔,不指定时默认1s。-c(可选参数)指定监控次数,不指定时持续监控。
操作成功,显示如下:
gpu   die   GPU_CLOCK
id    id    MHz
0     0     428
1     0     428
0     0     428
1     0     428
0     0     428
1     0     428
0     0     428
1     0     428
0     0     428
1     0     428
RESTful API:
curl -i -X GET http://[IP]:[PORT]/api/v1/stats?gpugroup=0\&fields=11\&delay=2000\&count=5
fields(指标)可替换为fieldgroup(指标组)。delay(可选参数)指定监控间隔,不指定时默认1s。count(可选参数)指定监控次数,不指定时持续监控。
操作成功,显示如下:
HTTP/1.1 200 OK
Content-Type: text/event-stream

{"stats":[{"gpuid":0,"dieid":0,"gpustats":[{"fieldid":11,"fieldname":"GPU_CLOCK","fieldunit":"MHz","value":"428"}]},{"gpuid":1,"dieid":0,"gpustats":[{"fieldid":11,"fieldname":"GPU_CLOCK","fieldunit":"MHz","value":"428"}]}]}

{"stats":[{"gpuid":0,"dieid":0,"gpustats":[{"fieldid":11,"fieldname":"GPU_CLOCK","fieldunit":"MHz","value":"428"}]},{"gpuid":1,"dieid":0,"gpustats":[{"fieldid":11,"fieldname":"GPU_CLOCK","fieldunit":"MHz","value":"428"}]}]}

{"stats":[{"gpuid":0,"dieid":0,"gpustats":[{"fieldid":11,"fieldname":"GPU_CLOCK","fieldunit":"MHz","value":"428"}]},{"gpuid":1,"dieid":0,"gpustats":[{"fieldid":11,"fieldname":"GPU_CLOCK","fieldunit":"MHz","value":"428"}]}]}

{"stats":[{"gpuid":0,"dieid":0,"gpustats":[{"fieldid":11,"fieldname":"GPU_CLOCK","fieldunit":"MHz","value":"428"}]},{"gpuid":1,"dieid":0,"gpustats":[{"fieldid":11,"fieldname":"GPU_CLOCK","fieldunit":"MHz","value":"428"}]}]}

{"stats":[{"gpuid":0,"dieid":0,"gpustats":[{"fieldid":11,"fieldname":"GPU_CLOCK","fieldunit":"MHz","value":"428"}]},{"gpuid":1,"dieid":0,"gpustats":[{"fieldid":11,"fieldname":"GPU_CLOCK","fieldunit":"MHz","value":"428"}]}]}
3.4.4. 停止监控
执行ctrl+c停止或者通过 -c/--count 指定监控次数。
3.5. 任务进程数据收集
mx-dcmd支持在后台收集数据、分析数据。这样,用户可以方便地收集任务级别的数据。
后台收集数据流程如图 3.1 所示。
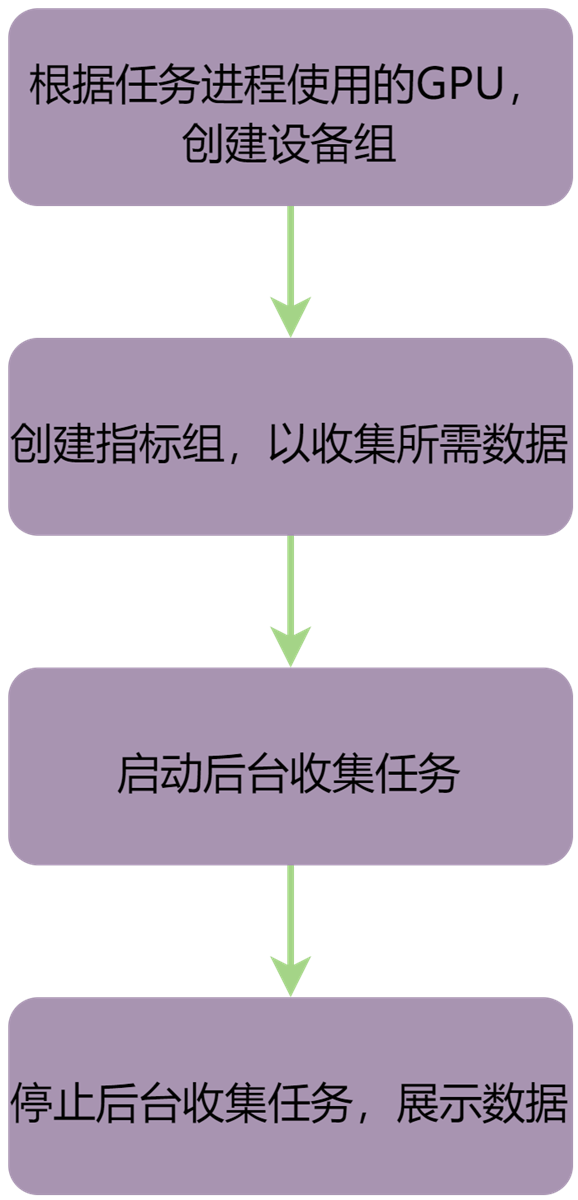
图 3.1 后台收集数据流程
3.5.1. 使用帮助
mx-dcmi stats -h
执行命令后,显示如下:
USAGE:
   mx-dcmi stats [-hv] {-j <jobName>]|-l|-r <jobName>|-s <jobName>|-x <jobName>} [-g <[0,63]>] [-m <duration>] [-u <interval>] [--host <IP:PORT>]

Where:
   --host <IP:PORT>
      The target host to connect.

   -g <[0,63]>, --fieldgroup <[0,63]>
      The gpu group to query on the job.

   -u <interval>, --interval <interval>
      How often to update the job stats in ms, default: 2000.

   -m <duration>, --duration <duration>
      How long to run the job in s, default: run till stop.

One of:
      -s <jobName>, --jstart <jobName>
      Start recording job statistics.

      -x <jobName>, --jstop <jobName>
      Stop recording job statistics.

      -r <jobName>, --jremove <jobName>
      Remove job statistics.

      -j <jobName>, --job <jobName>
      Display job statistics.

      -l, --list
      List all jobs.

   --, --ignore_rest
      Ignores the rest of the labeled arguments following this flag.

   -v, --version
      Displays version information and exits.

   -h, --help
      Displays usage information and exits.

   MetaX Data Center Management Interface
3.5.2. 启动后台收集任务
以下命令创建并启动test_job,收集group0的信息,更新间隔2000 ms,更新6次后停止。
其中,更新次数:11s/2000ms = 6。
mx-dcmi命令:
mx-dcmi stats --host [IP]:[PORT] -s test_job -g 0 -u 2000 -m 11
操作成功,显示如下:
Successfully started recording stats for test_job
RESTful API:
curl -i -X POST http://[IP]:[PORT]/api/v1/job/test_job?group=0\&interval=2000\&duration=11
操作成功,显示如下:
HTTP/1.1 200 0K
Content-Length: 0
3.5.3. 显示所有后台收集任务
mx-dcmi命令:
mx-dcmi stats --host [IP]:[PORT] -l
操作成功,显示如下:
=========== MetaX Data Center Management Interface Log ============
Timestamp                                 : Wed Nov 5 15:30:00 2025

+----------------------------------------------------------------+
| Job List                                                       |
+-------------+----------------+---------------------------------+
| Job Name    | State          | Gpus                            |
+-------------+----------------+---------------------------------+
| test_job2   | running        | 0, 1, 2, 3, 4, 5, 6, 7          |
| test_job    | stopped        | 0, 1, 2, 3, 4, 5, 6, 7          |
+-------------+----------------+---------------------------------+
RESTful API:
curl -i -X GET http://[IP]:[PORT]/api/v1/jobs
操作成功,显示如下:
HTTP/1.1 200 0K
Content-Length: 143

{"jobs":[{"jobname":"test_job2","state":"running","gpus":[0,1,2,3,4,5,6,7]},{"jobname":"test_job","state":"stopped","gpus":[0,1,2,3,4,5,6,7]}]}
3.5.4. 停止后台收集任务
mx-dcmi命令:
mx-dcmi stats --host [IP]:[PORT] -x test_job
操作成功,显示如下:
Successfully stopped recording stats for test_job
RESTful API:
curl -i -X PUT http://[IP]:[PORT]/api/v1/job/test_job?status=stop
操作成功,显示如下:
HTTP/1.1 200 0K
Content-Length: 0
3.5.5. 显示指定后台任务数据
mx-dcmi命令:
mx-dcmi stats --host [IP]:[PORT] -j test_job
操作成功,显示如下:
============ MetaX Data Center Management Interface Log =============
Timestamp                                   : Wed Nov 5 15:00:00 2025

+-------------------------------------------------------------------+
| Summary                                                           |
+-------------------------------+-----------------------------------+
| ----- Execution Stats ------- +-----------------------------------|
| Start Time                    | Wed Nov 6 15:00:00                |
| Update Time                   | Wed Nov 6 15:00:12                |
| Total Execution Time (sec)    | 12                                |
| No. of Processes Time         | 0                                 |
| ----- Power Usage (Watts)  ---+-----------------------------------|
| GPU0                          | Avg: 58.7, Max: 59.3 Min: 58.1    |
| GPU1                          |-Avg: 60.7, Max: 61.1 Min: 60.5    |
| GPU2                          | Avg: 56.8, Max: 57.1 Min: 56.5    |
| GPU3                          | Avg: 55.2, Max: 55.5 Min: 55.0    |
| GPU4                          | Avg: 62.5, Max: 62.8 Min: 62.3    |
| GPU5                          | Avg: 53.4, Max: 53.6 Min: 53.1    |
| GPU6                          | Avg: 55.6, Max: 55.9 Min: 55.1    |
| GPU7                          | Avg: 57.0, Max: 57.1 Min: 57.0    |
| --- Max Memory Utilization(%) +-----------------------------------|
| GPU0                          | 1.3                               |
| GPU1                          | 1.3                               |
| GPU2                          | 0.6                               |
| GPU3                          | 0.8                               |
| GPU4                          | 1.3                               |
| GPU5                          | 4.4                               |
| GPU6                          | 5.6                               |
| GPU7                          | 20.1                              |
| -----  Event Stats -----------+-----------------------------------|
| Single Bit ECC Errors         | Not Specified                     |
| Double Bit ECC Errors         | Not Specified                     |
| -----  Overall Health --------+-----------------------------------|
| Overall Health                | Healthy                           |
+-------------------------------+-----------------------------------+
RESTful API:
curl -i -X GET http://[IP]:[PORT]/api/v1/job/test_job
操作成功,显示如下:
HTTP/1.1 200 0K
Content-type: application/json
Content-Length: 830

{"starttime":"Wed Nov 6 15:00:00","updatetime":"Wed Nov 6 15:00:12","executetime":12,"processnumber":0,"devicenumber":8,"gpustatistics":[{"gpuid":0,"maxmemoryused":936048,"avgpower":58864,"maxpower":59262,"minpower":58055},{"gpuid":1,"maxmemoryused":936048,"avgpower":58864,"maxpower":59262,"minpower":58055},{"gpuid":2,"maxmemoryused":936048,"avgpower":58864,"maxpower":59262,"minpower":58055},{"gpuid":3,"maxmemoryused":936048,"avgpower":58864,"maxpower":59262,"minpower":58055},{"gpuid":4,"maxmemoryused":936048,"avgpower":58864,"maxpower":59262,"minpower":58055},{"gpuid":5,"maxmemoryused":936048,"avgpower":58864,"maxpower":59262,"minpower":58055},{"gpuid":6,"maxmemoryused":936048,"avgpower":58864,"maxpower":59262,"minpower":58055},{"gpuid":7,"maxmemoryused":936048,"avgpower":57023,"maxpower":57104,"minpower":56960}]}
3.5.6. 删除后台收集任务
mx-dcmi命令:
mx-dcmi stats --host [IP]:[PORT] -r test_job
操作成功,显示如下:
Successfully removed job test_job
RESTful API:
curl -i -X DELETE http://[IP]:[PORT]/api/v1/job/test_job
操作成功,显示如下:
HTTP/1.1 200 0K
Content-Length: 0
3.6. 设备健康状态监控
用户可以查看设备健康状态。
3.6.1. 使用帮助
mx-dcmi health -h
执行命令后,显示如下:
USAGE:
   mx-dcmi health  [-hv] [-c|-d|-e <type>|--clear] [-g <[0, 63]>] [--host
                  <IP:PORT>]
Where:

   --host <IP:PORT>
   The target host to connect.

   -g <[0, 63]>,  --group <[0, 63]>
   Group id

   Either of:
      -c,  --check
        Check to see if any errors or warnings have occurred in the enabled
        monitors.

      -d,  --disable
        Disable all monitors.

      -e <type>,  --enable <type>
        Enable specified monitor(s).
        a - all monitors
        l - log monitor
        e - event monitor
        Note: 'le' is valid for enabling log&event monitors

      --clear
        Clear errors and warnings have detected in the enabled monitors.
        Note: driver exception won't be cleared.

   --,  --ignore_rest
     Ignores the rest of the labeled arguments following this flag.

   -v,  --version
     Displays version information and exits.

   -h,  --help
     Displays usage information and exits.

   MetaX Data Center Management Interface
3.6.2. 检查设备健康状态
以下命令检查设备组#1在启用的监控项中是否发生告警。
mx-dcmi命令:
mx-dcmi health --host [IP]:[PORT] -c -g 1
操作成功,显示如下:
=========== MetaX Data Center Management Interface Log ===========
Timestamp                               : Mon Nov 10 11:59:29 2025

+----------------+-----------------------------------------------+
| Overall Health | Healthy                                       |
+----------------+-----------------------------------------------+
| GPU ID: 0      | Healthy                                       |
+----------------+-----------------------------------------------+
| GPU ID: 1      | Healthy                                       |
+----------------+-----------------------------------------------+
RESTful API:
curl -i -X GET http://[IP]:[PORT]/api/v1/health/gpugroup/1
操作成功,显示如下:
HTTP/1.1 200 OK
Content-type: application/json
Content-Length: 254

{"grouphealthinfo":"Healthy","driverexception":[],"gpuhealthinfo":[{"gpuid":0,"dieid":0,"healthinfo":{"errorlog":[],"fatallog":[],"hwexception":[],"memoryexception":[]}},{"gpuid":1,"dieid":0,"healthinfo":{"errorlog":[],"fatallog":[],"hwexception":[],"memoryexception":[]}}]}
3.6.3. 启用监控项
以下命令启用Log和Event监控。
mx-dcmi命令:
mx-dcmi health --host [IP]:[PORT] -e le
操作成功,显示如下:
Successfully enable health monitor, type 3.
RESTful API:
curl -i -X POST http://[IP]:[PORT]/api/v1/health/3
操作成功,显示如下:
HTTP/1.1 200 OK
Content-Length: 0
3.6.4. 禁用所有监控项
以下命令禁用所有监控项。
mx-dcmi命令:
mx-dcmi health --host [IP]:[PORT] -d
操作成功,显示如下:
Successfully disable health monitors.
RESTful API:
curl -i -X DELETE http://[IP]:[PORT]/api/v1/health
操作成功,显示如下:
HTTP/1.1 200 OK
Content-Length: 0
3.6.5. 清除告警
以下命令清除设备组#1启用监控项中已经检测到的告警。
mx-dcmi命令:
mx-dcmi health --host [IP]:[PORT] --clear -g 1
操作成功,显示如下:
Successfully clear group 1 health monitors.
RESTful API:
curl -i -X DELETE http://[IP]:[PORT]/api/v1/health/gpugroup/1
操作成功,显示如下:
HTTP/1.1 200 OK
Content-Length: 0
3.7. 设备自检
用户可以使用自检功能检查设备状况。自检前建议关闭虚拟化。
3.7.1. 使用帮助
mx-dcmi diag -h
执行命令后,显示如下:
USAGE:
   mx-dcmi diag  [-hjv] [-c <PATH>] [-g <[0, 63]>] [-r <[1|2|3|4|software|pcie|mxlk|ops|mem>] [--host <IP:PORT>]

Where:
   --host <IP:PORT>
     The target host to connect.

   -g <[0, 63]>,  --group <[0, 63]>
     The group ID to query.

   -c <PATH>,  --configfile <PATH>
     Path to the configuration file in json format.

   -j,  --json
     Print detailed result in json format.

   --generate-template
      Generate diag config template file.

   -r <1|2|3|4|software|pcie|mxlk|ops|mem>,  --run <1|2|3|4|software|pcie|mxlk|ops|mem>
     Run a diagnostic.
     (Note: higher numbered tests include all beneath.)
     1 - Quick (System Validation ~ seconds)
     2 - Medium (Extended System Validation ~ 2 minutes)
     3 - Long (System HW Diagnostics ~ 15 minutes)
     4 - Extended (Longer-running System HW Diagnostics)
     Specific module diagnostic to run by name
     Module name: software, pcie, mxlk, ops, mem

   -p <product name>, --product <product name>
     Specify metax product name to generate diag config file.
     Supported product: MXC500,MXC550,MXC588,MXN300-A,MXC600-A,MXX206,MXX301V1,MXX302V1

   -s, --short
     Start the diagnostic and disconnect
     get the status by -l, get the result by -f

   Either of:
     -l, --list
       List the diagnostic status.

     -f, --fetch
       Get the diagnostic info
       specify gpu group id by -g, default 0

   --,  --ignore_rest
     Ignores the rest of the labeled arguments following this flag.

   -v,  --version
   Displays version information and exits.

   -h,  --help
   Displays usage information and exits.

MetaX Data Center Management Interface
3.7.2. 自检项目
3.7.2.1. 自检项目说明
项目类别 |
所属级别 |
所属类型 |
说明 |
|---|---|---|---|
MxSml check |
Level 1 |
Deployment |
检查libmxsml.so是否可用。 |
Maca check |
Level 1 |
Deployment |
检查MXMACA软件栈是否可用。 |
Permission Check |
Level 1 |
Deployment |
检查用户权限。 |
Compiler Check |
Level 1 |
Deployment |
检查编译器是否可用。 |
Nouveau Check |
Level 1 |
Deployment |
检查Nouveau驱动是否禁用。 |
Environment Variable Check |
Level 1 |
Deployment |
检查环境变量设置。 |
Power Mode Check |
Level 1 |
Deployment |
检查是否开启高功耗模式,可通过 |
PCIe |
Level 2 |
Integration |
检查PCIe speed(GT/s),lanes和最大带宽(MB/s),单向双向带宽测试,P2P测试及压力测试。 |
MetaXLink |
Level 2 |
Integration |
检查MetaXLink speed(GT/s),lanes和最大带宽(MB/s)。 |
OPS |
Level 2 |
Hardware |
精度为INT8、BF16、FP16、FP32_vector、FP32_matrix、TF32的算力指标测试。自检配置文件对应 |
Memory |
Level 2 |
Hardware |
HBM申请大内存测试,及HBM带宽测试。 |
Gpu Burn |
Level 3 |
Hardware |
压力测试,检查功耗,使用率。自检配置文件及自检结果对应 |
Pulse Test |
Level 4 |
Hardware |
功耗波动测试。 |
Memory Test |
Level 4 |
Hardware |
共有11种类型的Memory测试。 |
3.7.2.2. 自检项目诊断时间
自检级别 |
诊断时间(参考) |
|---|---|
Level 1 |
< 2 秒 |
Level 2 |
< 2 分钟 |
Level 3 |
< 30 分钟 |
Level 4 |
< 2 小时 |
3.7.3. 执行自检
3.7.3.1. 默认基准自检
用户可使用默认基准直接执行Level1~Level4的自检,当前仅支持 MXC500, MXC550, MXC588, MXN300-A, MXC600-A, MXX206, MXX301V1,及 MXX302V1。
模块自检目前仍需指定配置文件进行自检。
mx-dcmi命令:
mx-dcmi diag --host [IP]:[PORT] -r {1|2|3|4}
3.7.3.2. 用户自定义基准自检
执行以下命令可生成默认指标配置文件diag-config-MXC500.json。
mx-dcmi命令:
mx-dcmi diag --generate-template --host [IP]:[PORT] --product <product name>
其中 --product 为产品名称,目前支持 MXC500, MXC550, MXC588, MXN300-A, MXC600-A, MXX206, MXX301V1,及 MXX302V1。
若不填则默认生成 MXC500 配置文件。
当执行Level1自检时,无须指定配置文件。用户可根据实际期望进行调整,若希望跳过某个项目的检查,可直接将对应项目整段删除。
执行以下命令指定用户自定义的配置文件diag-config-MXC500-modified.json进行自检:
mx-dcmi命令:
mx-dcmi diag --host [IP]:[PORT] -r {2|3|4} -c diag-config-MXC500-modified.json
3.7.4. 自检示例
3.7.4.1. Level 1自检
mx-dcmi命令:
mx-dcmi diag --host [IP]:[PORT] -r 1
操作成功,显示如下:
============= MetaX Data Center Management Interface Log =============
Timestamp                                   : Mon Nov 10 14:36:07 2025
+-----------------------------+--------------------------------------+
| Diagnostic                  | Result                               |
+-----------------------------+--------------------------------------+
| ------ Deployment ----------+--------------------------------------|
| MxSml Library               | Pass                                 |
| Maca Library                | Pass                                 |
| Permission Check            | Pass                                 |
| Compiler Check              | Pass                                 |
| Nouveau Check               | Pass                                 |
| Environment Variable Check  | Pass                                 |
| Power Mode Check            | Normal                               |
+-----------------------------+--------------------------------------+
3.7.4.2. RESTful API方式自检
获取MetaXLink自检结果,其中 -d 的入参为期望的MetaXLink指标结果。MetaXLink测试属于Level 2检测,对于其他Level 2检测项不予检测,显示为 skip。
mx-dcmi命令:
curl -i -X POST -d '{"metaxlink": {"bw_uni_p2p": 92000,"bw_bi_p2p": 181000,"speed": 32,"width": 16}}' http://[IP]:[PORT]/api/v1/diag/mxlk
操作成功,显示如下:
HTTP/1.1 200 OK
Content-type: application/json
Content-Length: 1126
{
   "software": {
         "mxsml": "pass",
         "maca": "pass",
         "permission": "pass",
         "compiler": "pass",
         "nouveau": "pass",
         "envvar": "pass",
         "powermode": "normal"
   },
   "pcie": {
         "result": "skip"
   },
   "metaxlink": {
         "result": "pass",
   "p2p_uni": [
      {
         "src": 0,
         "dst": 1,
         "bandwidth": 101677
      },
      {
         "src": 1,
         "dst": 0,
         "bandwidth": 98684
      }
   ],
   "p2p_bi": [
      {
         "src": 0,
         "dst": 1,
         "bandwidth": 191145
      }
   ],
   "mxlkspeedwidth": [
      {
         "gpuid": 0,
         "speed": 32.0,
         "width": 16
      },
      {
         "gpuid ": 1,
         "speed": 32.0,
         "width": 16
      }
   ]
   },
   "perf": {
         "result": "skip"
   },
   "memory": {
         "memAllocResult": "skip",
         "memBwResult": "skip"
   }
}
3.7.4.3. 指定模块自检
用户使用自定义配置文件指定模块进行自检,以HBM为例。
mx-dcmi命令:
mx-dcmi diag --host [IP]:[PORT] -r mem -c mxdcm-diag.json
操作成功,显示如下:
============= MetaX Data Center Management Interface Log =============
Timestamp                                   : Mon Nov 10 14:36:07 2025
+-----------------------------+--------------------------------------+
| Diagnostic                  | Result                               |
+-----------------------------+--------------------------------------+
| ------ Deployment ----------+--------------------------------------|
| MxSml Library               | Pass                                 |
| Maca Library                | Pass                                 |
| Permission Check            | Pass                                 |
| Compiler Check              | Pass                                 |
| Nouveau Check               | Pass                                 |
| Environment Variable Check  | Pass                                 |
| Power Mode Check            | Normal                               |
+-----------------------------+--------------------------------------+
| ------ Hardware ------------+--------------------------------------|
| Memory MAX                  | Pass                                 |
| Memory Bandwidth            | Pass                                 |
+-----------------------------+--------------------------------------+
3.7.4.4. 查询自检执行状态和结果
备注
该功能仅支持 Level1~Level4自检,暂不支持模块自检。
用户使用 --short, -L, --fetch 组合进行自检状态及结果查询。
执行Level3自检。
mx-dcmi命令:
mx-dcmi diag --host [IP]:[PORT] -r 3 --short
操作成功,显示如下:
Diagnostic request has started successfully
Use mx-dcmi diag -l/-f to get diagnostic status/result.
查询Level3自检执行状态。
mx-dcmi命令:
mx-dcmi diag --host [IP]:[PORT] -l
操作成功,显示如下:
=========== MetaX Data Center Management Interface Log =========
Timestamp                              : Tue Nov 4 14:36:07 2025
+-------------------------+------------------------------------+
| Group Id                | Result                             |
+-------------------------+------------------------------------+
| 0                       | Pass                               |
+-------------------------+------------------------------------+
当状态从
Running变为Pass或Fail时,可查询Level3自检结果。mx-dcmi命令:
mx-dcmi diag --host [IP]:[PORT] -f
操作成功,显示如下:
============= MetaX Data Center Management Interface Log =============
Timestamp                                    : Tue Nov 4 14:36:07 2025
+-----------------------------+--------------------------------------+
| Diagnostic                  | Result                               |
+-----------------------------+--------------------------------------+
| ------ Deployment ----------+--------------------------------------|
| MxSml Library               | Pass                                 |
| Maca Library                | Pass                                 |
| Permission Check            | Pass                                 |
| Compiler Check              | Pass                                 |
| Nouveau Check               | Pass                                 |
| Environment Variable Check  | Pass                                 |
| Power Mode Check            | Normal                               |
+-----------------------------+--------------------------------------+
| ------ Integration ---------+--------------------------------------|
| PCIe                        | Pass                                 |
| MetaXLink                   | Pass                                 |
+-----------------------------+--------------------------------------+
| ------ Hardware ------------+--------------------------------------|
| Ops                         | Pass                                 |
| Memory MAX                  | Pass                                 |
| Memory Bandwidth            | Pass                                 |
| Gpu Burn                    | Pass                                 |
| Pulse Test                  | Skip                                 |
| Memory Test                 | Skip                                 |
+-----------------------------+--------------------------------------+
3.7.4.5. 指定设备进行自检
仅对指定设备进行自检,需新建设备组(参见 3.2.2 创建设备组),将设备放入组中(参见 3.2.3 添加设备到设备组),再进行自检。
执行以下命令指定设备组(Group ID:1)进行Level2自检。
mx-dcmi命令:
mx-dcmi diag --host [IP]:[PORT] -r 2 -g 1
操作成功,显示如下:
============= MetaX Data Center Management Interface Log =============
Timestamp                                   : Tue Nov 4 14:36:07 2025
+-----------------------------+--------------------------------------+
| Diagnostic                  | Result                               |
+-----------------------------+--------------------------------------+
| ------ Deployment ----------+--------------------------------------|
| MxSml Library               | Pass                                 |
| Maca Library                | Pass                                 |
| Permission Check            | Pass                                 |
| Compiler Check              | Pass                                 |
| Nouveau Check               | Pass                                 |
| Environment Variable Check  | Pass                                 |
| Power Mode Check            | Normal                               |
+-----------------------------+--------------------------------------+
| ------ Integration ---------+--------------------------------------|
| PCIe                        | Pass                                 |
| MetaXLink                   | Pass                                 |
+-----------------------------+--------------------------------------+
| ------ Hardware ------------+--------------------------------------|
| Ops                         | Pass                                 |
| Memory MAX                  | Pass                                 |
| Memory Bandwidth            | Pass                                 |
+-----------------------------+--------------------------------------+
3.7.4.6. 显示json格式的自检结果
以下命令指定Level 1自检,以json格式显示结果。
mx-dcmi命令:
mx-dcmi diag --host [IP]:[PORT] -r 1 -j
操作成功,显示如下:
============= MetaX Data Center Management Interface Log =============
Timestamp                                  : Mon Nov 10 14:36:26 2025

{
   "software": {
      "mxsml": "pass",
      "maca": "pass",
      "permission": "pass",
      "compiler": "pass",
      "nouveau": "pass",
      "envvar": "pass",
      "powermode": "normal"
   }
}
3.8. 配置管理
用户可以对GPU卡进行DPM等级设置。
3.8.1. 使用帮助
mx-dcmi config -h
执行命令后,显示如下:
USAGE:

   mx-dcmi config  [-hv] [--set] [-d <[0.9]>|--show-max-dpm] [-g <[0,63]>] [--host <IP:PORT>]


Where:

   --host <IP:PORT>
     The target host to connect.

   -g <[0,63]> ,  --group <[0,63]>
     Group id.

   Either of:
     --show-max-dpm
       Print max dpm level.

     --set
     Set configuration.

     -d <[0.9]>, --max-dpm <[0.9]>
       Set max dpm level

   --,  --ignore_rest
     Ignores the rest of the labeled arguments following this flag.

   -v,  --version
     Displays version information and exits.

   -h,  --help
     Displays usage information and exits.

   MetaX Data Center Management Interface
3.8.2. 查看设备DPM等级
mx-dcmi命令:
mx-dcmi config --host [IP]:[PORT] --show-max-dpm
操作成功,显示如下:
============= MetaX Data Center Management Interface Log =======================
Timestamp                                              : Fri Jan 9 16:04:47 2026

+---------------------+--------------------------------------------------------+
| GROUPS                                                                       |
+---------------------+--------------------------------------------------------+
+---------------------+--------------------------------------------------------+
| GroupID             |  0                                                     |
| GPU:MaxDpmLevel(s) |  0:P9, 1:P9, 2:P9, 3:P9, 4:P9, 5:P9, 6:P9, 7:P9, 8:P9  |
+---------------------+--------------------------------------------------------+

End of Log
3.8.3. 设置设备DPM等级
mx-dcmi命令:
mx-dcmi config --host [IP]:[PORT] --set -max-dpm 5
操作成功,显示如下:
mx-dcmi version: xxx
Config max dpm =5 for gpus of group 0 successfully
再次查看DPM等级,显示为 P5:
mx-dcmi config --host [IP]:[PORT] --show-max-dpm

============= MetaX Data Center Management Interface Log =======================
Timestamp                                              : Fri Jan 9 16:24:17 2026

+---------------------+--------------------------------------------------------+
| GROUPS                                                                       |
+---------------------+--------------------------------------------------------+
+---------------------+--------------------------------------------------------+
| GroupID             |  0                                                     |
| GPU:MaxDpmLevel(s) |  0:P5, 1:P5, 2:P5, 3:P5, 4:P5, 5:P5, 6:P5, 7:P5, 8:P5  |
+---------------------+--------------------------------------------------------+

End of Log
3.9. 拓扑查询
用户可以使用拓扑查询功能查看GPU设备的拓扑连接。
3.9.1. 使用帮助
mx-dcmi topo -h
执行命令后,显示如下:
USAGE:

   mx-dcmi topo  [-hv] {-g |--gpuid } [--host ]


Where:

   --host
     The target host to connect.

   One of:
      --gpuid
        The gpu ID to query.

      -g ,  --group
        The group ID to query.

   --,  --ignore_rest
     Ignores the rest of the labeled arguments following this flag.

   -v,  --version
     Displays version information and exits.

   -h,  --help
     Displays usage information and exits.

   MetaX Data Center Management Interface
3.9.2. 查看设备拓扑信息
mx-dcmi命令:
mx-dcmi topo --host [IP]:[PORT] {-g |--gpuid }
操作成功,显示如下:
============= MetaX Data Center Management Interface Log ============
Timestamp                                   : Wed Nov 19 22:04:47 2025

+-------------------+-----------------------------------------------+
| GPU ID: 0         | Topology Information                          |
+-------------------+-----------------------------------------------+
| CPU Core Affinity | 0-39,80-119                                   |
+-------------------+-----------------------------------------------+
| To GPU 1          | Connected via a metaxlink                     |
+-------------------+-----------------------------------------------+
| To GPU 2          | Connected via a metaxlink                     |
+-------------------+-----------------------------------------------+
| To GPU 3          | Connected via a metaxlink                     |
+-------------------+-----------------------------------------------+
| To GPU 4          | Connected via a CPU-level link (the same numa)|
+-------------------+-----------------------------------------------+
| To GPU 5          | Connected via a CPU-level link (the same numa)|
+-------------------+-----------------------------------------------+
| To GPU 6          | Connected via a CPU-level link (the same numa)|
+-------------------+-----------------------------------------------+
| To GPU 7          | Connected via a CPU-level link (the same numa)|
+-------------------+-----------------------------------------------+

End of Log
3.10. 网卡诊断
用户可以使用自检功能检查单机网卡状况,也可对网卡进行单机和跨机的性能测试与压力测试。
3.10.1. 使用帮助
mx-dcmi nic -h
执行命令后,显示如下:
USAGE:

   mx-dcmi nic  [-hjlv] [--generate-template] [--show-qos-info][-c <PATH>]
                [-r <1|2|3>] [--client-gpu-list <clientgpulist>]
                [--client-nic-list <clientniclist>] [--gpu-id <gpuid>]
                [--host <IP:PORT>] [--nic-id <nicid>] [--operation <[0,
                2]>] [--server-gpu-id <servergpuid>] [--server-nic-id
                <servernicid>] [--server-num <servernum>] [--socket-address
                <socketaddress>] [--test-mode <[0, 3]>] [--type <[0, 1]>]


Where:

   -l,  --list
   List all Nic info on the host.

   --host <IP:PORT>
   The target host to connect.

   --test-mode <[0, 3]>
   Query diagnostic test-mode:
   0 - do diagnostic on the target Nic
   1 - do burn diagnostic on the target Nic
   2 - start the target Nic as burn diagnostic server
   3 - start the target Nic as burn diagnostic client

   --nic-id <nicid>
   Target Nic Id

   --gpu-id <gpuid>
   Target Gpu Id

   --server-nic-id <servernicid>
   Server Nic Id

   --server-num <servernum>
   Server Count

   --server-gpu-id <servergpuid>
   Server Gpu Id

   --client-nic-list <clientniclist>
   Client Nic List

   --client-gpu-list <clientgpulist>
   Client Gpu List

   --socket-address <socketaddress>
   Socket Address

   --operation <[0, 2]>
   Query diagnostic operation:
   0 - Send (ib_send_*)
   1 - Read (ib_read_*)
   2 - Write (ib_write_*)

   --type <[0, 1]>
   Query diagnostic type:
   0 - bw (ib_*_bw)
   1 - lat (ib_*_lat)

   -c <PATH>,  --configfile <PATH>
   Path to the configuration file in json format.

   -j,  --json
   Print detailed result in json format.

   --generate-template
   Generate Nic diag config template file.

   --show-qos-info
     Show Qos Info. Need use with --list

   -r <1|2|3>,  --run <1|2|3>
   Run a Nic diagnostic.
   (Note: higher numbered tests include all beneath.)
   1 - Quick (Nic basic diagnostic ~ seconds)
   2 - Medium (Nic diagnostic include ib write perftest ~ 15 minutes)
   3 - Long (Nic diagnostic include ib write burntest ~ 30 minutes)

   --,  --ignore_rest
   Ignores the rest of the labeled arguments following this flag.

   -v,  --version
   Displays version information and exits.

   -h,  --help
   Displays usage information and exits.

   MetaX Data Center Management Interface
3.10.2. 查询网卡信息
mx-dcmi命令:
mx-dcmi nic --host [IP]:[PORT] -l [–-nic-id <nicid>]
如需显示指定网卡信息,使用 –-nic-id <nicid> 指定。
操作成功,显示如下:
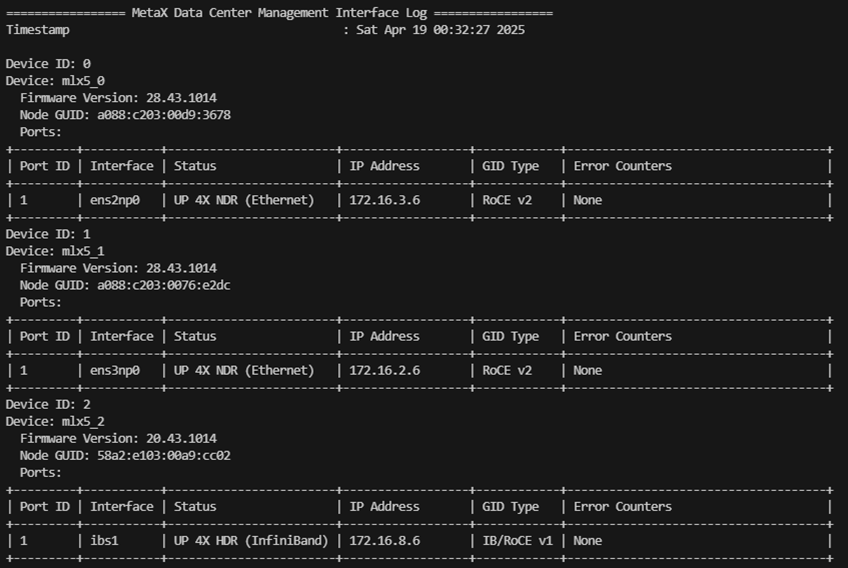
图 3.2 查询网卡信息
3.10.3. 自检项目
3.10.3.1. 自检项目说明
项目类别 |
所属级别 |
说明 |
|---|---|---|
Driver Version Check |
Level 1 |
检测网卡驱动版本 |
Firmware Version Check |
Level 1 |
检测网卡固件版本 |
Kernel Syslog Check |
Level 1 |
检查网卡在内核中的日志 |
Device Name Check |
Level 1 |
检测网卡的名称 |
Port State Check |
Level 1 |
监测网卡端口状态(UP/DOWN)IP地址 |
Error counters Check |
Level 1 |
检测网卡的错误计数器 |
Qos Configuratioin |
Level 1 |
包括ECN/PFC,TC,PRIO配置检查 配置文件中默认值说明如下:
|
Interface Name Check |
Level 1 |
检测网卡接口名称 |
Perf test byself (write) for all nic |
Level 2 |
对本服务器所有网卡进行性能测试(RDMA写入) |
Perf burn test (write) for all nic |
Level 3 |
对本服务器所有网卡进行压力测试(RDMA写入) |
高级别的检测包含所有低级别的检测内容。若低级别的测试结果中有失败,则不会执行高级别的测试,显示为 Skip。
例如,执行Level 3的测试时,Level 2的测试结果为失败,则默认不执行Level 3的测试内容,Level 3的测试结果为 Skip。
3.10.3.2. 基准配置文件
执行Level 1自检前,可用以下命令生成环境对应的配置文件nic-diag-config.json。生成的配置文件中网卡的信息仅包含与设备相连接的网卡,其他网卡默认不在其中。
参见 3.10.2 查询网卡信息 获取对应网卡的 ip_address 信息。
若相关检查项目内容为空,则会跳过该项检查;若检查结果等同于配置文件中的内容,则该项检查通过,否则失败。
失败或检查项目为空,会在对应项目中列出发生失败或跳过的网卡名称。
用户可根据需要自行修改配置文件进行测试。
mx-dcmi命令:
mx-dcmi nic --generate-template --host [IP]:[PORT]
以下 nic-diag-config.json 仅为示例,同时包含IB网卡及ROCE网卡配置,用户可根据实际需要进行调整。
{
      "Driver Version": "xxx",
      "Nic Info":{
           "InfinitBand": [
               {
                    "firmware version": "xxx",
                    "port state": "UP 4X NDR (InfiniBand)",
                    "device list":[
                        "mlx5_7",
                        "mlx5_5",
                        "mlx5_3",
                        "mlx5_0"
                     ]
               }
            ],
           "Ethernet":[
               {
                   "firmware version": "xxx",
                    "port state": "UP 1X QDR (Ethernet)",
                    "device list":[
                        {
                            "device name": "mlx5_8",
                            "interface name": "xxx",
                            "ip info": "x.x.x.x/24"
                        }
                     ],
                    "Qos Configuration": {
                        "priority trust state":"dscp",
                        "cmaRoceTos":"160",
                        "trafficClass":"160",
                        "pfc priority enabled":"0,0,0,0,0,1,0,0",
                        "pfc priority buffer":"0,0,0,0,0,1,0,0",
                        "ecn Np priority enabled":"1,1,1,1,1,1,1,1",
                        "ecn Np cnp_802_prio":"6",
                        "ecn Np cnp_dscp":"48",
                        "ecn Rp priority enabled":"1,1,1,1,1,1,1,1"
                     }
                }
            ]
      },
      "Performance Test Metrics":{
          "bandwidth test metrics":"0.95",
          "latency test metrics":"2"
      }
}
3.10.4. 自检示例
3.10.4.1. Level 1自检
mx-dcmi命令:
mx-dcmi nic --host [IP]:[PORT] -r 1 -c <config_file>
操作成功,显示如下:
============= MetaX Data Center Management Interface Log ==================
Timestamp                                    : Thu Nov 20 09:22:29 2025

+------------------------------------+------------------------------------+
| Diagnostic                         | Result                             |
+------------------------------------+------------------------------------+
| ------ NIC Self Check -------------+------------------------------------|
| Driver Version Check               | Pass                               |
| Firmware Version Check             | Pass                               |
| Kernel Syslog Check                | Pass                               |
| Device Names Check                 | Pass                               |
| Port State Check                   | Pass                               |
| Error Counters Check               | Pass                               |
| Interface Names Check              | Pass                               |
| Ip Address Check                   | Pass                               |
|----QoS Configuratioin Check--------+------------------------------------+
| Priority trust state Check         | Pass                               |
| Cma Roce Tos Check                 | Pass                               |
| Traffic Class Check                | Pass                               |
| PFC Configuration enabled  Check   | Pass                               |
| PFC Configuration buffer Check     | Pass                               |
| ECN Np Configuration enabled Check | Pass                               |
| Cnp 802p Prio Check                | Pass                               |
| Cnp Dscp Check                     | Pass                               |
| ECN Rp Configuration enabled Check | Pass                               |
+------------------------------------+------------------------------------+

End of Log
3.10.4.2. 显示json格式的自检结果
以下命令指定Level 2自检,以json格式显示结果。
mx-dcmi命令:
mx-dcmi nic --host [IP]:[PORT] -c nic-diag-config.json -r 2 -j
操作成功,显示如下:
{"Driver version":{"Result":"pass"},"Firmware version":{"Result":"pass"},"Kernel syslog":{"Result":"pass"},"Device names":{"Result":"pass"},"Port state":{"Result":"pass"},"Interface names":{"Result":"pass"},"Ip address":{"Result":"pass"},"Error counters":{"Result":"pass"},"Perftest":{"Result":"skip"},"Priority trust state":{"Result":"pass"},"Cnp 802p Prio":{"Result":"pass"},"Cnp Dscp":{"Result":"pass"},"Cma Rock Tos":{"Result":"skip"},"Traffic Class":{"Result":"pass"},"PFC Configuration enabled":{"Result":"pass"},"PFC Configuration buffer":{"Result":"pass"},"ECN Np Configuration enabled":{"Result":"pass"},"ECN Rp Configuration enabled":{"Result":"pass"}}
3.10.5. 单机RDMA性能测试
3.10.5.1. 基本命令格式
用户可根据自己的需求自由组合测试,且可同GPUDirect结合使用,以评估网络和GPU的性能。
备注
当测试结果不理想时,会给出具体原因分析及建议。
mx-dcmi命令:
mx-dcmi nic --host [IP]:[PORT] --test-mode 0 --nic-id <nicid> [--operation <0|1|2>] [--type <0|1>] [--gpu-id <gpuid>]
参数 |
说明 |
|---|---|
|
被测服务器IP地址及mxdcmd服务端口 |
|
指定测试模式, |
|
网卡ID |
|
指定RDMA测试类型。 |
|
指定测试类型。 |
|
指定目标设备ID进行GPU Direct测试 |
3.10.5.2. 示例1:读取数据带宽测试
mx-dcmi命令:
mx-dcmi nic --host [IP]:[PORT] --test-mode 0 --nic-id 1 --operation 1 --type 0
操作成功,显示如下:
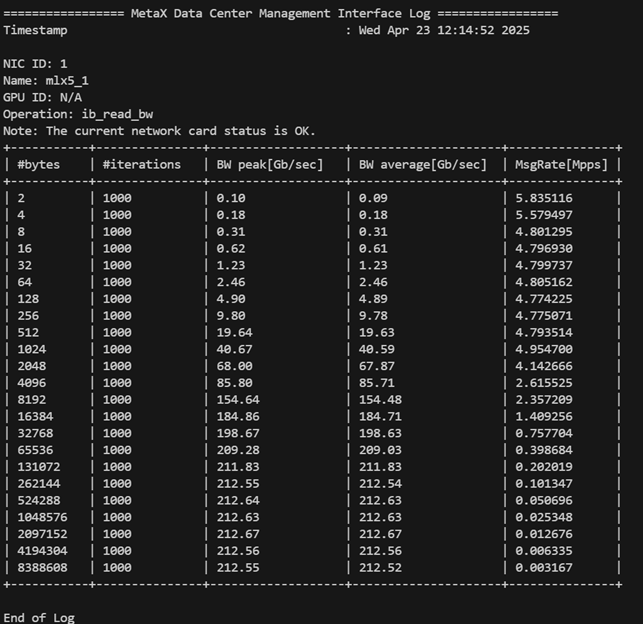
图 3.3 读取数据带宽测试
3.10.5.3. 示例2:写入数据带宽测试(RESTful API)
mx-dcmi命令:
curl -i -X POST http://[IP]:[PORT]/api/v1/nic/ibs/ibtest?testmode=r\&server=3\&operation=write\&type=bw
操作成功,显示如下:
HTTP/1.1 200 OK
Content-type: application/json
Content-type: application/json
Content-Length: 3372

{"results":[{"deviceId":3,"name":"mlx5_2","operation":"ib_write_bw","type":0,"result":[
{"Bytes":2,"Iterations":5000,"BW Peak":0.06857100129127502,"BW Average":0.0682080015540123,"Msg Rate":4.262992858886719,"analysisResult":0},
{"Bytes":4,"Iterations":5000,"BW Peak":0.12999999523162842,"BW Average":0.12999999523162842,"Msg Rate":3.9534409046173096,"analysisResult":0},
{"Bytes":8,"Iterations":5000,"BW Peak":0.23999999463558197,"BW Average":0.23999999463558197,"Msg Rate":3.7158620357513428,"analysisResult":0},
{"Bytes":16,"Iterations":5000,"BW Peak":0.46000000834465027,"BW Average":0.46000000834465027,"Msg Rate":3.588594913482666,"analysisResult":0},
{"Bytes":32,"Iterations":5000,"BW Peak":0.9100000262260437,"BW Average":0.9100000262260437,"Msg Rate":3.5382909774780273,"analysisResult":0},
{"Bytes":64,"Iterations":5000,"BW Peak":1.6100000143051147,"BW Average":1.6100000143051147,"Msg Rate":3.1451549530029297,"analysisResult":0},
{"Bytes":128,"Iterations":5000,"BW Peak":3.4000000953674316,"BW Average":3.4000000953674316,"Msg Rate":3.3210930824279785,"analysisResult":0},
{"Bytes":256,"Iterations":5000,"BW Peak":6.440000057220459,"BW Average":6.440000057220459,"Msg Rate":3.1433870792388916,"analysisResult":0},
{"Bytes":512,"Iterations":5000,"BW Peak":12.899999618530273,"BW Average":12.850000381469727,"Msg Rate":3.1373159885406494,"analysisResult":0},
{"Bytes":1024,"Iterations":5000,"BW Peak":26.030000686645508,"BW Average":26.020000457763672,"Msg Rate":3.1757090091705322,"analysisResult":0},
{"Bytes":2048,"Iterations":5000,"BW Peak":63.47999954223633,"BW Average":63.380001068115234,"Msg Rate":3.868633985519409,"analysisResult":0},
{"Bytes":4096,"Iterations":5000,"BW Peak":118.8499984741211,"BW Average":118.29000091552734,"Msg Rate":3.6099469661712646,"analysisResult":0},
{"Bytes":8192,"Iterations":5000,"BW Peak":192.2100067138672,"BW Average":191.22999572753906,"Msg Rate":2.917980909347534,"analysisResult":0},
{"Bytes":16384,"Iterations":5000,"BW Peak":207.5800018310547,"BW Average":207.5,"Msg Rate":1.5830650329589844,"analysisResult":0},
{"Bytes":32768,"Iterations":5000,"BW Peak":210.83999633789063,"BW Average":210.1999969482422,"Msg Rate":0.8018640279769897,"analysisResult":0},
{"Bytes":65536,"Iterations":5000,"BW Peak":211.94000244140625,"BW Average":211.94000244140625,"Msg Rate":0.40423500537872314,"analysisResult":0},
{"Bytes":131072,"Iterations":5000,"BW Peak":212.13999938964844,"BW Average":212.1199951171875,"Msg Rate":0.20229299366474152,"analysisResult":0},
{"Bytes":262144,"Iterations":5000,"BW Peak":212.22999572753906,"BW Average":212.22999572753906,"Msg Rate":0.10119900107383728,"analysisResult":0},
{"Bytes":524288,"Iterations":5000,"BW Peak":212.17999267578125,"BW Average":212.13999938964844,"Msg Rate":0.050579000264406204,"analysisResult":0},
{"Bytes":1048576,"Iterations":5000,"BW Peak":212.22000122070313,"BW Average":212.1199951171875,"Msg Rate":0.025287000462412834,"analysisResult":0},
{"Bytes":2097152,"Iterations":5000,"BW Peak":212.17999267578125,"BW Average":212.0500030517578,"Msg Rate":0.012639000080525875,"analysisResult":0},
{"Bytes":4194304,"Iterations":5000,"BW Peak":212.17999267578125,"BW Average":212.0500030517578,"Msg Rate":0.006320000160485506,"analysisResult":0},
{"Bytes":8388608,"Iterations":5000,"BW Peak":212.1199951171875,"BW Average":212.0800018310547,"Msg Rate":0.003160000080242753,"analysisResult":0}]}]}
3.10.5.4. 示例3:读取数据延时测试(GPUDirect)
mx-dcmi命令:
mx-dcmi nic --host [IP]:[PORT] --test-mode 0 --nic-id 1 --operation 0 --type 1 --gpu-id 0
操作成功,显示如下:
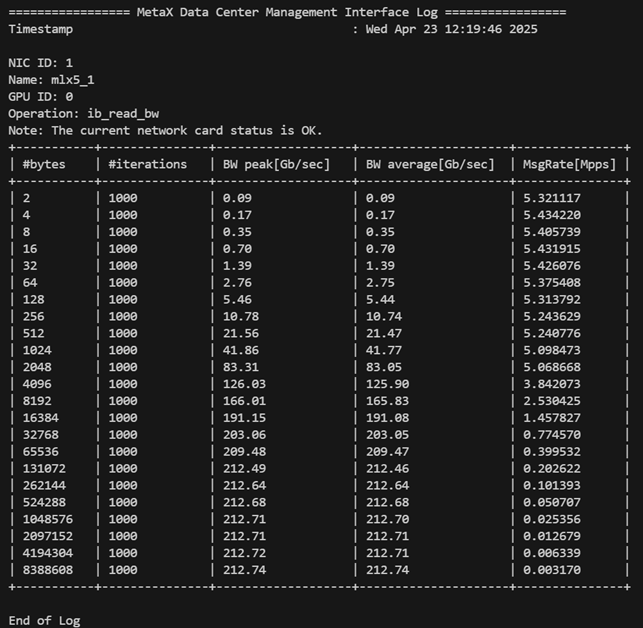
图 3.4 读取数据延时测试
3.10.6. 单机RDMA压力测试
3.10.6.1. 基本命令格式
用户可根据自己的需求自由组合测试单机和跨机环境下的RDMA 压力测试,包括GPUDirect支持的场景。
备注
当测试结果不理想时,会给出具体原因分析及建议。
mx-dcmi命令:
mx-dcmi nic --host [IP]:[PORT] –-test-mode 1 --server-nic-id <servernicid> --client-nic-list <clientniclist> [--operation <0|1|2>] [--type <0|1>] [--server-gpu-id <servergpuid>] [--client-gpu-list <clientgpulist>]
参数 |
说明 |
|---|---|
|
被测服务器IP地址及mxdcmd服务端口 |
|
指定测试模式, |
|
指定测试的服务端网卡ID,注意需要指定与GPU相连的网卡ID,若为管理口及存储口,则不能测试 |
|
指定测试的客户端网卡ID,注意需要指定与GPU相连的网卡ID,若为管理口及存储口,则不能测试。当有多个网卡需要测试时,需用 “,” 分隔,如:1,2,3 |
|
指定测试的服务端设备ID进行GPUDirect测试 |
|
指定测试的客户端设备ID进行GPUDirect测试,个数需与 |
|
指定RDMA测试类型。 |
|
指定测试类型。 |
3.10.6.2. 示例1:读取数据带宽压力测试
mx-dcmi nic --host [IP]:[PORT] --test-mode 1 --server-nic-id 0 --client-nic-list 1,3 --operation 1
操作成功,网卡1测试结果显示如下:
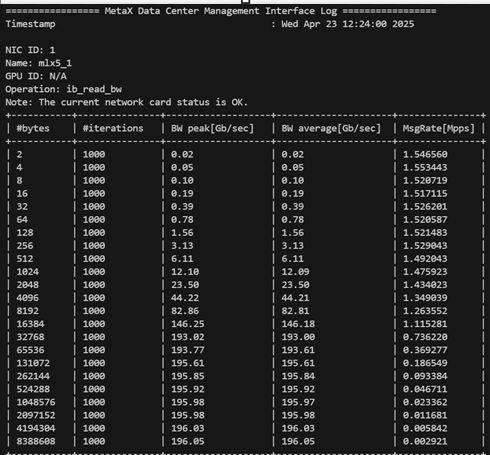
图 3.5 读取数据带宽压力测试网卡1结果
网卡3测试结果显示如下:
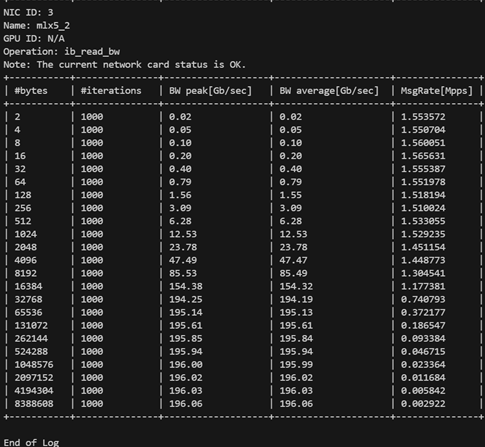
图 3.6 读取数据带宽压力测试网卡3结果
3.10.6.3. 示例2:读取数据带宽压力测试(GPUDirect)
mx-dcmi nic --host [IP]:[PORT] --test-mode 1 --server-nic-id 0 --client-nic-list 1,3 --server-gpu-id 0 --client-gpu-list 1,2 --operation 1
操作成功,网卡1测试结果显示如下:
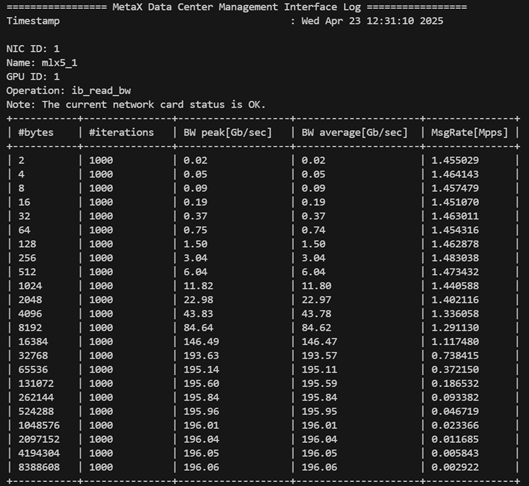
图 3.7 GPUDirect读取数据带宽压力测试网卡1结果
网卡3测试结果显示如下:
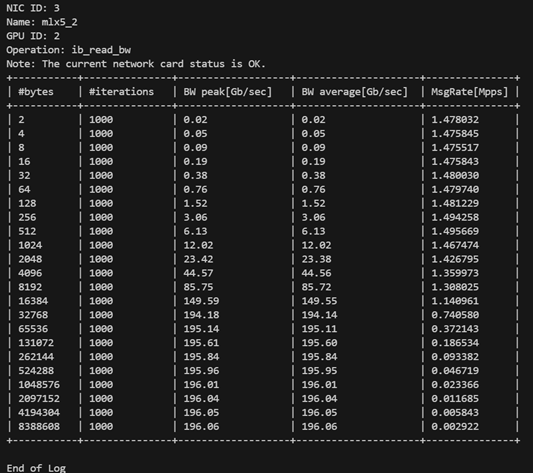
图 3.8 GPUDirect读取数据带宽压力测试网卡3结果
3.10.7. 跨机RDMA压力测试
3.10.7.1. 基本命令格式
用户可根据自己的需求自由组合测试单机和跨机环境下的RDMA 压力测试,包括GPUDirect支持的场景。
备注
当测试结果不理想时,会给出具体原因分析及建议。
服务端:
mx-dcmi nic --host [IP1]:[PORT1] –-test-mode 2 --server-nic-id <servernicid> --server-num <servernum> [--operation <0|1|2>] [--type <0|1>] [--server-gpu-id <servergpuid>]
参数 |
说明 |
|---|---|
|
被测服务器IP地址及mxdcmd服务端口 |
|
指定测试模式, |
|
指定测试的服务端网卡ID,注意需要指定与GPU相连的网卡ID,若为管理口及存储口,则不能测试 |
|
指定测试的服务端端口个数,个数需与对应的list中ID个数相同,当大于1时,仅返回第一个端口。该端口在测试结束后会释放,如要继续测试,则需重启动Server及Client |
|
指定测试的服务端设备ID进行GPUDirect测试 |
|
指定RDMA测试类型。 |
|
指定测试类型。 |
客户端:
mx-dcmi nic --host [IP2]:[PORT2] –-test-mode 3 --client-nic-list <clientniclist> --socket-address [IP1]:[PORT3] [--operation <0|1|2>] [--type <0|1>] [--client-gpu-list <clientgpulist>]
参数 |
说明 |
|---|---|
|
被测服务器IP地址及mxdcmd服务端口 |
|
指定测试模式, |
|
指定测试的客户端网卡ID,注意需要指定与GPU相连的网卡ID,若为管理口及存储口,则不能测试。当有多个网卡需要测试时,需用 “,” 分隔,如:1,2,3 |
|
指定测试要连接的服务端IP和端口号,指定时为Server端返回的IP及端口,若IP为内部IP地址,则需改为Server所在的HOST IP |
|
指定测试的客户端设备ID进行GPUDirect测,个数需与 |
|
指定RDMA测试类型。0为发送(send)操作, |
|
指定测试类型。 |
3.10.7.2. 示例1:跨机写入数据带宽压力测试
服务端:
mx-dcmi nic --host [IP1]:[PORT1] --test-mode 2 --server-nic-id 6 --server-num 2
命令返回socket address 用于客户端使用。
操作成功,显示如下:
============= MetaX Data Center Management Interface Log =============
Timestamp                                   : Wed Apr 23 12:50:54 2025

Socket Address: 172.17.26.36:23515
客户端:
mx-dcmi nic --host [IP2]:[PORT2] --test-mode 3 --client-nic-list 3,4 --socket-address [IP1]:23515
操作成功,网卡3测试结果显示如下:
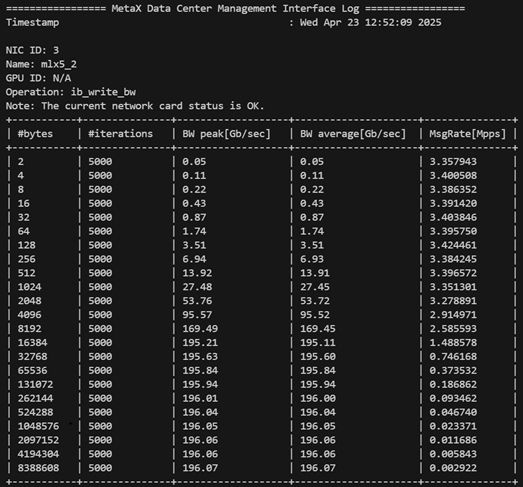
图 3.9 跨机写入数据带宽压力测试网卡3结果
网卡4测试结果显示如下:
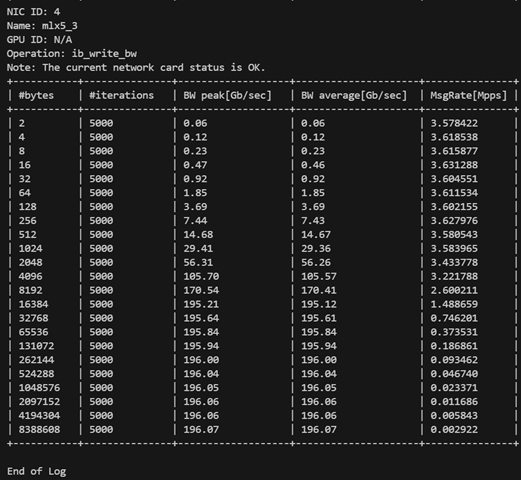
图 3.10 跨机写入数据带宽压力测试网卡4结果
3.10.7.3. 示例2:跨机写入数据带宽压力测试(GPUDirect)
服务端:
mx-dcmi nic --host [IP1]:[PORT1] --test-mode 2 --server-nic-id 4 --server-gpu-id 3 --server-num 2
命令返回socket address 用于客户端使用。
操作成功,显示如下:
============= MetaX Data Center Management Interface Log =============
Timestamp :                                   Wed Apr 23 12:39:27 2025

Socket Address: 172.17.22.36:21515
客户端:
mx-dcmi nic --host [IP2]:[PORT2] --test-mode 3 --client-gpu-list 1,3 --client-nic-list 0,3 --socket-address [IP1]:21515
操作成功,网卡1测试结果显示如下:
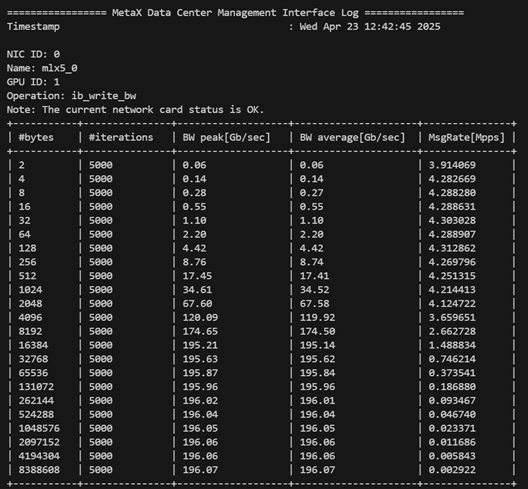
图 3.11 GPUDirect跨机写入数据带宽压力测试网卡1结果
网卡3测试结果显示如下:
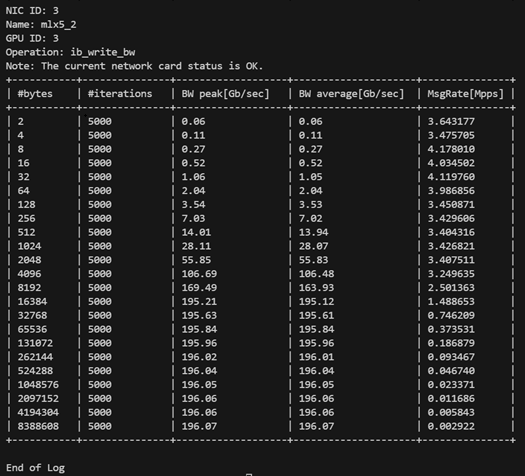
图 3.12 GPUDirect跨机写入数据带宽压力测试网卡3结果
3.11. MCCL诊断
用户可使用 mccl 子命令对网卡执行MCCL测试。主要功能为生成测试配置模板、执行MCCL压力测试、查询测试结果以及测试任务管理。
前提条件:
集群环境中,被测服务器已部署多个GPU设备及Infiniiband网卡,且配置一致。
mx-dcmd 可部署于参与MCCL测试的主机,或集群中与测试主机配置一致的其他主机;无需在集群的每台被测服务器上部署mx-dcmd。
mx-dcmi 正常运行在管理节点、不参加测试的服务器、参加测试的服务器均可。
服务器之间已设置免密登录。
3.11.1. 使用帮助
mx-dcmi mccl -h
执行命令后,显示如下:
USAGE:

   mx-dcmi mccl  [-hv] {-g |-j |-l|-r |-s |
               -x } [-c ] [--host ]


Where:

   --host
   The target host to connect.

   -c ,  --configfile
   Path to the configuration file in json format. Must be used in
   conjunction with -s/--start.

   One of:
      -s ,  --start
      Start Mccl stress job with the configuration file.

      -x ,  --stop
      Stop Mccl stress job.

      -r ,  --remove
      Remove Mccl stress job.

      -j ,  --job
      Display Mccl stress result.

      -g ,  --generate-template
      Generate Mccl diag config template file with wanted ip list.

      -l,  --list
      List all Mccl stress job info on the host.

   --,  --ignore_rest
   Ignores the rest of the labeled arguments following this flag.

   -v,  --version
   Displays version information and exits.

   -h,  --help
   Displays usage information and exits.

   MetaX Data Center Management Interface
3.11.2. 配置文件
执行MCCL前需要用户提供MCCL测试所需参数配置。
执行以下命令可生成默认指标配置文件 mccl-diag-config.json。
mx-dcmi命令:
mx-dcmi mccl --host [IP]:[PORT] –g "<PATH>"
[IP]:[PORT]为收集MCCL日志的服务器,已启动mx-dcmd且正常运行。<PATH>指定被测主机列表全路径,如"/home/user/ip.txt",当为""时,将根据[IP]:[PORT]信息自动生成一份配置文件。
以下 mccl-diag-config.json 仅为示例,用户可根据实际需要进行调整。
{
   "perf_type": "all_gather_perf",
   "mgmt_interface_name": "bond0",
   "mgmt_ip_mask": "10.200.146.192/26",
   "mgmt_ip_address": "10.200.146.235,10.200.146.226",
   "node": "3",
   "nic_dev": "mlx5_4, mlx5_1, mlx5_6, mlx5_3, mlx5_2, mlx5_0, mlx5_7, mlx5_5",
   "duration": "43200"
   "standard_agl_bandwidth": 37.19
}
项目类别 |
说明 |
|---|---|
|
测试类型,目前支持 |
|
服务器管理口名称 |
|
服务器管理口掩码,当跨地址段时,需手动修改该参数 |
|
被测服务器地址列表,可直接手动修改配置文件,生成配置文件传入的IP列表会全部显示在这里 |
|
每组参与测试的服务器个数,若需跑单机,可填 |
|
与GPU设备相连接的网卡列表,可根据实际情况手动修改 |
|
单位:秒,测试持续时间,默认为43200秒(24小时) |
测试类别 |
对应通讯原语 |
|---|---|
|
AllReduce |
|
AllGather |
|
ReduceScatter |
|
Send/Recv |
|
AllToAll |
备注
详细介绍参见《沐曦通用GPU MCCL编程指南》。
3.11.3. MCCL测试基本命令
本章节以测试任务 mccl_test 为例。
3.11.3.1. 启动MCCL测试
mx-dcmi命令:
mx-dcmi mccl --host [IP]:[PORT] --start mccl_test --configfile <config_file>
--host为收集MCCL日志的服务器,已启动mx-dcmd且正常运行。--start传入任务名称(jobname)。--configfile传入可用于测试的配置文件。
备注
最多可创建64个任务。
操作成功,显示如下:
Successfully started Mccl diag for mccl_test
3.11.3.2. 查询测试任务状态
待MCCL测试开始3分钟后可查询测试任务状态。
mx-dcmi命令:
mx-dcmi mccl --host [IP]:[PORT] -l
操作成功,显示如下:
================ MetaX Data Center Management Interface Log ==================
Timestamp                                          : Mon Nov  20 16:52:49 2025
Mccl stress job list
+-----------+------------+----------------------+-----------+----------------+
| Job Name  | Node List  | Env Variable         |  State    | Exception Node |
+-----------+------------+----------------------+-----------+----------------+
| mccl_test | x.x.x.x    | FORCE_ACTIVE_WAIT=2  |  Running  | None           |
+-----------+------------+----------------------+-----------+----------------+
3.11.3.3. 查看测试结果
mx-dcmi命令:
mx-dcmi mccl --host [IP]:[PORT] -j mccl_test
操作成功,显示如下:
============== MetaX Data Center Management Interface Log ==============
Timestamp                                   : Tue Apr 22 16:43:13 2025

{
   "results": [{
   "node_list": "x.x.x.x:8",
   "perf_type": " all_gather_perf",
   "nic_dev": " mlx5_7, mlx5_3, mlx5_2, mlx5_0, mlx5_4, mlx5_6, mlx5_1, mlx5_5",
   "iter": "5",
   "pass_time":"5",
   "start_time": "2025-11-19 16:43:52",
   "end_time": "2025-11-19 16:44:13",
   "standard_alg_bandwidth":"37.189999",
   "mission_rate":"100.00%",
   "min_alg_bandwidth": "180.96",
   "max_alg_bandwidth": "181.67",
   "test_result":"pass"
   }]
}
MCCL测试结果会存放在 mxdcmd-log 文件夹下,命名为 mccl_stress_log_x_<pid>.log,若以容器方式启动mxdcmd,需进入容器内查看该文件夹。
pid为测试任务的进程ID。x为MCCL的测试组数,若有多组测试,将生成同一个PID下的多组测试日志。
若查询到测试任务状态很快为 stopped 时,表明已经出错,可通过结果查看具体出错原因,如下所示:
=============== MetaX Data Center Management Interface Log ===============
Timestamp                                   : Wed Apr 23 13:14:18 2025

   {
      "results": [{
      "node_list": "10.200.146.235:8,10.200.146.226:8",
      "perf_type": " all_gather_perf",
      "nic_dev": " mlx5_4, mlx5_6, mlx5_3, mlx5_2, mlx5_0, mlx5_7, mlx5_5",
      "iter": "1",
      "error": "  : Test NCCL failure all_gather.cu:47 'internal error / Proxy Call to rank 15 failed (Connect)'"
      }]
   }
3.11.3.4. 终止测试任务
mx-dcmi命令:
mx-dcmi mccl --host [IP]:[PORT] -x mccl_test
操作成功,显示如下:
Successfully stopped Mccl diag for mccl_test
再次查询mccl_test状态,显示 stopped:
=============== MetaX Data Center Management Interface Log ================
Timestamp                                       : Mon Nov  20 17:52:49 2025
Mccl stress job list
+-----------+------------+---------------------+---------+------------------+
| Job Name  | Node List  | Env Variable        | State   |  Exception Node  |
+-----------+------------+---------------------+---------+------------------+
| mccl_test | x.x.x.x    | FORCE_ACTIVE_WAIT=2 | STOPPED |  None            |
+-----------+------------+---------------------+---------+------------------+

End of Log
3.11.3.5. 删除测试任务
mx-dcmi命令:
mx-dcmi mccl --host [IP]:[PORT] -r mccl_test
操作成功,显示如下:
Successfully remove Mccl diag for mccl_test
再次查询任务状态:
============= MetaX Data Center Management Interface Log =============
Timestamp                                   : Wed Apr 23 13:20:51 2025
Mccl stress job list
+-------------------------------------+
| There is no job                     |
+-------------------------------------+

End of Log