7. 告警规则
在Prometheus的配置文件mx-exporter/deployment/Prometheus/config-map.yaml中可定义告警规则,当环境中相关指标达到了触发告警的条件,则会展示告警信息。仅当环境相应指标恢复正常时,告警才可消除。
告警名称(alert) |
触发表达式(expr) |
严重程度定义(severity) |
处理建议 |
|---|---|---|---|
GPU not available |
mx_gpu_state == 0 |
critical |
如果有EID告警,参考EID处理建议; 如果没有EID,先重启,重启后如果问题依旧存在,联系售后 |
MetaXLink speed anomaly |
mx_mxlk_bw > 0 AND mx_mxlk_speed < 32 AND mx_gpu_usage > 0 |
critical |
先重启,如果重启后问题依旧存在,联系售后 |
MetaXLink width anomaly |
mx_mxlk_width > 0 AND mx_mxlk_width < 16 AND mx_gpu_usage > 0 |
critical |
先重启,如果重启后问题依旧存在,联系售后 |
PCIe speed anomaly |
mx_pcie_speed < 32 AND mx_gpu_usage > 0 |
critical |
先重启,如果重启后问题依旧存在,联系售后 |
PCIe width anomaly |
mx_pcie_width < 16 AND mx_gpu_usage > 0 |
critical |
先重启,如果重启后问题依旧存在,联系售后 |
Over temperature |
mx_chip_hotspot_temp > 110 |
critical |
停止业务,重启并检查服务器散热;如果散热正常,重启后问题依旧存在,联系售后 |
Too high temperature |
mx_chip_hotspot_temp > 100 AND mx_chip_hotspot_temp <= 110 |
major |
温度过高,检查散热并持续关注 |
High temperature |
mx_chip_hotspot_temp > 85 AND mx_chip_hotspot_temp <= 100 |
warning |
无需处理,持续关注 |
Clock throttle reason |
mx_clk_thr > 1 |
major |
0x2: 人为限制了性能,找运维人员处理; 0x4, 0x80, 0x100, 0x200: 电源功耗相关,联系售后; |
Important driver EID error |
mx_driver_eid_errors == 4362 OR mx_driver_eid_errors == 8451 OR mx_driver_eid_errors == 8454 OR mx_driver_eid_errors == 8456 OR mx_driver_eid_errors == 8460 OR mx_driver_eid_errors == 8461 OR mx_driver_eid_errors == 8462 OR mx_driver_eid_errors == 8705 OR mx_driver_eid_errors == 8962 OR mx_driver_eid_errors == 8967 OR mx_driver_eid_errors == 8968 OR mx_driver_eid_errors == 12817 |
critical |
参考EID处理建议 |
Driver EID error |
mx_driver_eid_errors > 0 |
major |
参考EID处理建议 |
Driver kernel error |
increase(mx_driver_log_errors[5m]) > 0 |
major |
执行 |
Too many SRAM and DRAM errors |
increase(mx_ecc_error_count[1h]) > 3 |
critical |
联系售后 |
SRAM and DRAM uncorrectable errors |
increase(mx_ecc_error_count{type=~”.*_ue”}[5m]) > 0 |
major |
先重启,重启后如果问题依旧存在,联系售后 |
SRAM and DRAM correctable errors |
increase(mx_ecc_error_count{type=~”.*_ce”}[5m]) > 0 |
minor |
无需处理 |
Too many SRAM correctable errors |
mx_ecc_error_count{type=”sram_ce”} > 255 |
critical |
先重启,重启后如果问题依旧存在,联系售后 |
Correctable error count grows too fast |
sum by (Hostname, deviceId) (label_replace(increase(mx_mxlk_aer_count{type=”ce”}[1d]),”__error_source__”, “mxlk”, “”, “”) OR label_replace(increase(mx_pci_event{type=”aer_ce”}[1d]),”__error_source__”, “pci”, “”, “”) OR label_replace(increase(mx_ecc_error_count{type=~”.*_ce”}[1d]),”__error_source__”, “ecc”, “”, “”)) > 24 OR sum by (Hostname, deviceId) (label_replace(increase(mx_mxlk_aer_count{type=”ce”}[1h]),”__error_source__”, “mxlk”, “”, “”) OR label_replace(increase(mx_pci_event{type=”aer_ce”}[1h]),”__error_source__”, “pci”, “”, “”) OR label_replace(increase(mx_ecc_error_count{type=~”.*_ce”}[1h]),”__error_source__”, “ecc”, “”, “”)) > 10 |
major |
联系售后 |
RAS uncorrectable error count |
increase(mx_ras_count{register_name=~”.*ue”}[5m]) > 0 |
major |
先重启,重启后如果问题依旧存在,联系售后 |
RAS correctable error count |
increase(mx_ras_count{register_name=~”.*ce”}[5m]) > 0 |
minor |
无需处理 |
PCI event which belongs to uncorrectable error count |
increase(mx_pci_event{type=~”aer_ue”}[5m]) > 0 |
major |
先重启,重启后如果问题依旧存在,联系售后 |
PCI event which belongs to correctable error count |
increase(mx_pci_event{type=~”aer_ce”}[5m]) > 0 |
minor |
无需处理 |
MetaXLink AER which belongs to uncorrectable error count |
increase(mx_mxlk_aer_count{type=”ue”}[5m]) > 0 |
major |
先重启,重启后如果问题依旧存在,联系售后 |
MetaXLink AER which belongs to correctable error count |
increase(mx_mxlk_aer_count{type=”ce”}[5m]) > 0 |
minor |
无需处理 |
Bad page detected continuously |
increase(mx_ecc_error_count{type=”retired_page”}[1h]) > 2 |
major |
先重启,重启后如果问题依旧存在,联系售后 |
Too many retired pages |
mx_ecc_error_count{type=”retired_page”} > 64 |
critical |
联系售后 |
ETH interface anomaly due to software bug |
increase(mx_eth_port_counter{counter_name=”fatal_op”}[5m]) > 0 OR increase(mx_eth_port_counter{counter_name=”fatal_cq”}[5m]) > 0 OR increase(mx_eth_port_counter{counter_name=”fatal_retry”}[5m]) > 0 OR increase(mx_eth_port_counter{counter_name=”fatal_rx”}[5m]) > 0 |
major |
联系售后 |
ETH interface link instability |
increase(mx_eth_port_counter{counter_name=”icrc_err”}[5m]) > 0 OR increase(mx_eth_port_counter{counter_name=”len_err”}[5m]) > 0 |
major |
插拔ETH线缆,若问题依旧存在,联系售后。 |
级别 |
说明 |
|---|---|
critical |
紧急,业务中断。GPU硬件故障,掉卡等 |
major |
重要,业务受影响。不可恢复的错误,降频,降速等 |
minor |
次要,非业务影响,但需关注。可恢复的错误等 |
warning |
提示潜在风险。比如温度偏高逼近降频阈值 |
7.1. Prometheus UI告警展示
当mx-exporter和Prometheus部署完毕后,在浏览器输入<k8s_master_ip>:<prometheus_service_port>,prometheus_service_port默认为30000。 打开Prometheus UI界面,点击Alerts栏,可查看所有定义的告警信息。
如图 7.1 所示,可以看到规则 metax gpu alerting rules 中定义的告警列表。
当无告警发生时,会显示为绿色且有0条活跃的告警信息;当有告警发生时,告警条目为红色,并显示告警数量。
点击下拉框可看到告警详细信息描述,包括告警名称,触发表达式,严重程度,标签信息,状态,告警产生时间点等。
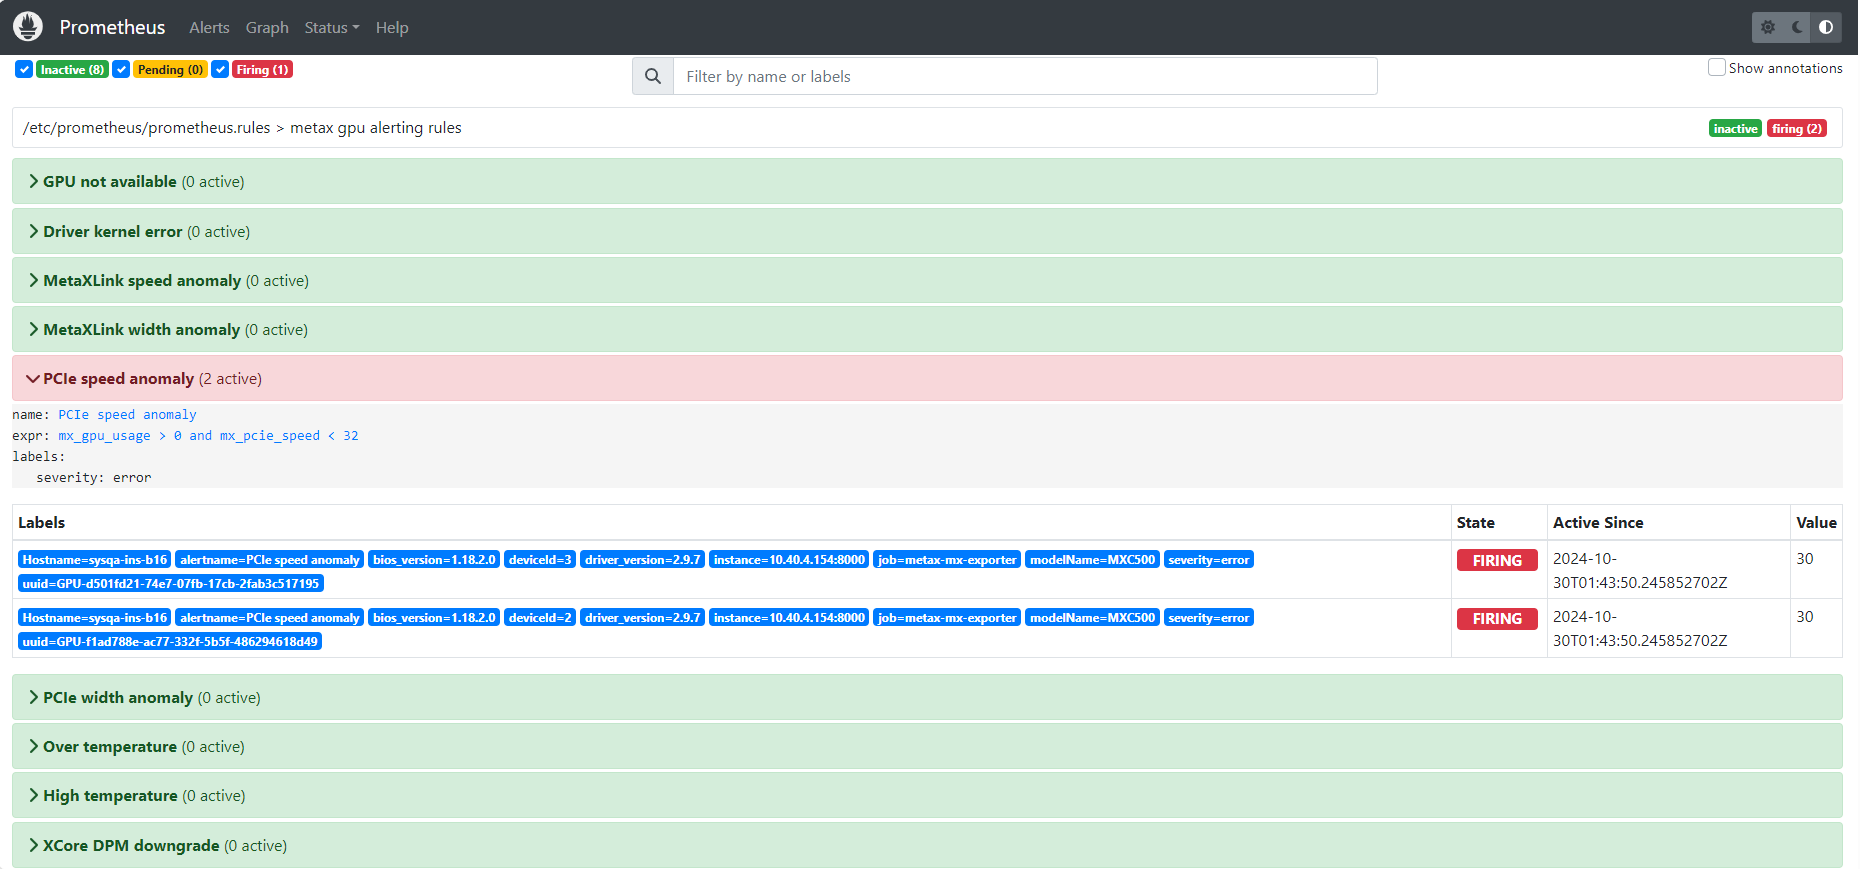
图 7.1 Prometheus告警展示
7.2. Grafana告警展示
上传告警展示文件 mx-exporter/deployment/grafana-dashboard/MetaX-Alert.json,操作步骤参见 6.2 添加监控模板。
当有告警发生时,展示页面如图 7.2 所示。左边区域展示了告警列表信息,右边区域展示各条目告警持续时间。
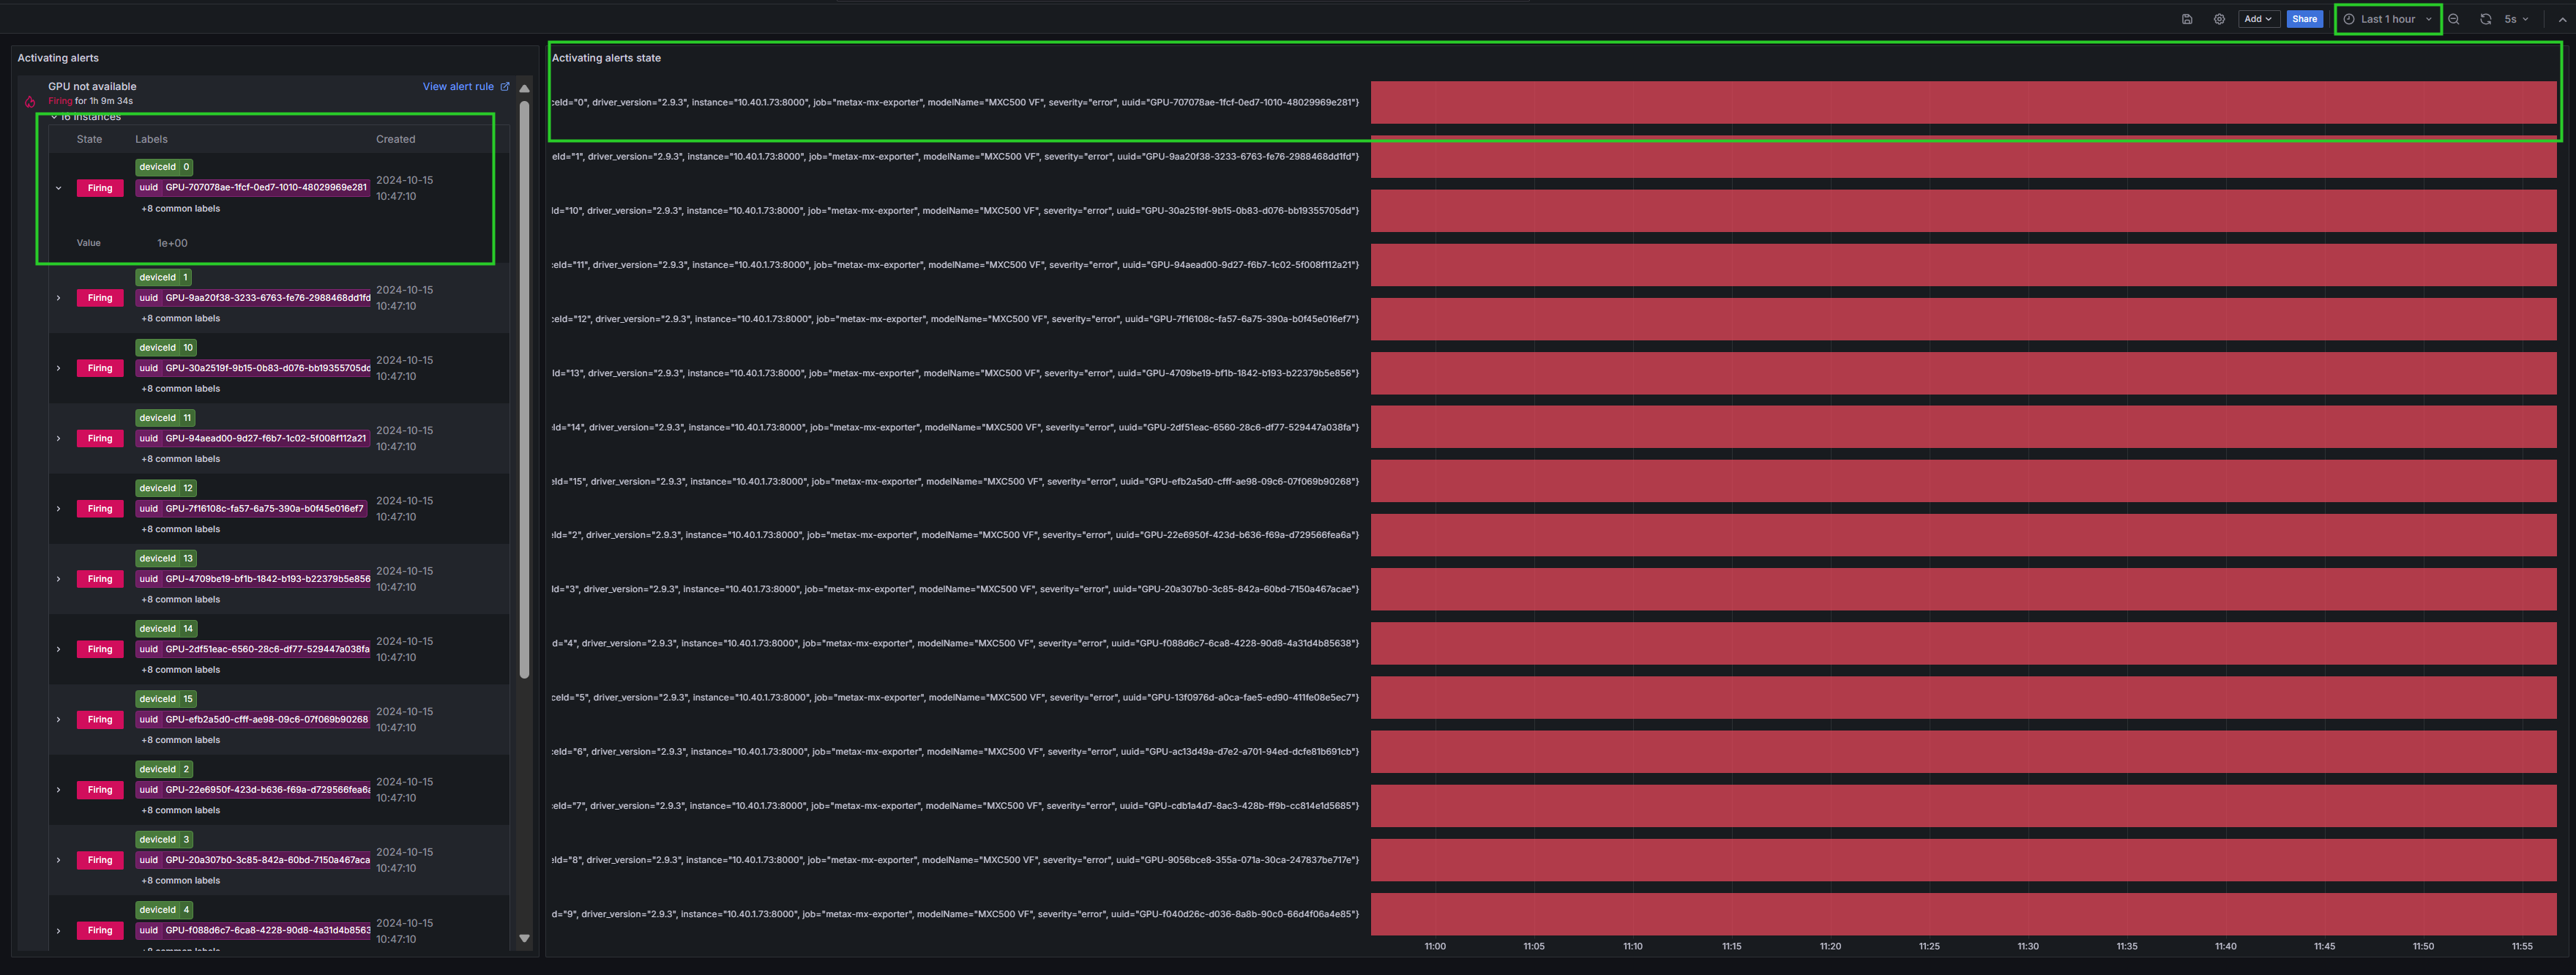
图 7.2 Grafana告警展示
点击图 7.2 中左边区域的右上角 View alert rule,可查看告警详细信息,如图 7.3 所示。

图 7.3 告警详细信息