7. 告警规则
在Prometheus的配置文件mx-exporter/deployment/Prometheus/config-map.yaml中可定义告警规则,当环境中相关指标达到了触发告警的条件,则会展示告警信息。仅当环境相应指标恢复正常时,告警才可消除。
告警名称(alert) |
触发表达式(expr) |
严重程度定义(severity) |
|---|---|---|
GPU not available |
mx_gpu_state == 0 |
error |
Driver kernel error |
mx_driver_log_error > 0 |
error |
MetaXLink speed anomaly |
mx_mxlk_bw > 0 AND mx_mxlk_speed < 32 |
error |
MetaXLink width anomaly |
mx_mxlk_width > 0 AND mx_mxlk_width < 16 |
error |
PCIe speed anomaly |
mx_gpu_usage > 0 AND mx_pcie_speed < 32 |
error |
PCIe width anomaly |
mx_gpu_usage > 0 AND mx_pcie_width < 16 |
error |
Over temperature |
mx_chip_hotspot_temp > 110 OR mx_board_core_temp > 115 |
error |
High temperature |
mx_chip_hotspot_temp > 100 OR mx_board_core_temp > 100 (for 30s) |
warning |
XCore DPM downgrade |
mx_gpu_usage > 0 AND mx_xcore_dpm_level < 5 |
error |
Clock throttle reason |
mx_clk_thr > 1 |
warning |
SRAM and DRAM uncorrectable errors |
mx_ecc_error_count{type=~”.*_ue”} > 0 |
error |
SRAM and DRAM correctable errors |
mx_ecc_error_count{type=~”.*_ce”} > 0 |
warning |
RAS uncorrectable error count |
mx_ras_count{register_name=~”.*ue”} > 0 |
error |
RAS correctable error count |
mx_ras_count{register_name=~”.*ce”} > 0 |
warning |
PCI event which belongs to uncorrectable error count |
mx_pci_event{type=~”aer_ue”} > 0 |
error |
PCI event which belongs to correctable error count |
mx_pci_event{type=~”aer_ce”} > 0 |
warning |
Driver EID error |
mx_driver_eid_errors > 0 |
warning |
MetaXLink AER which belongs to uncorrectable error count |
mx_mxlk_aer_count{type=”ue”} > 0 |
error |
7.1. Prometheus UI告警展示
当mx-exporter和Prometheus部署完毕后,在浏览器输入<k8s_master_ip>:<prometheus_service_port>,prometheus_service_port默认为30000。 打开Prometheus UI界面,点击Alerts栏,可查看所有定义的告警信息。
如图 7.1 所示,可以看到规则 metax gpu alerting rules 中定义的告警列表。
当无告警发生时,会显示为绿色且有0条活跃的告警信息;当有告警发生时,告警条目为红色,并显示告警数量。
点击下拉框可看到告警详细信息描述,包括告警名称,触发表达式,严重程度,标签信息,状态,告警产生时间点等。

图 7.1 Prometheus告警展示
7.2. Grafana告警展示
上传告警展示文件 mx-exporter/deployment/grafana-dashboard/MetaX-Alert.json,操作步骤参见 6.2 添加监控模板。
当有告警发生时,展示页面如图 7.2 所示。左边区域展示了告警列表信息,右边区域展示各条目告警持续时间。
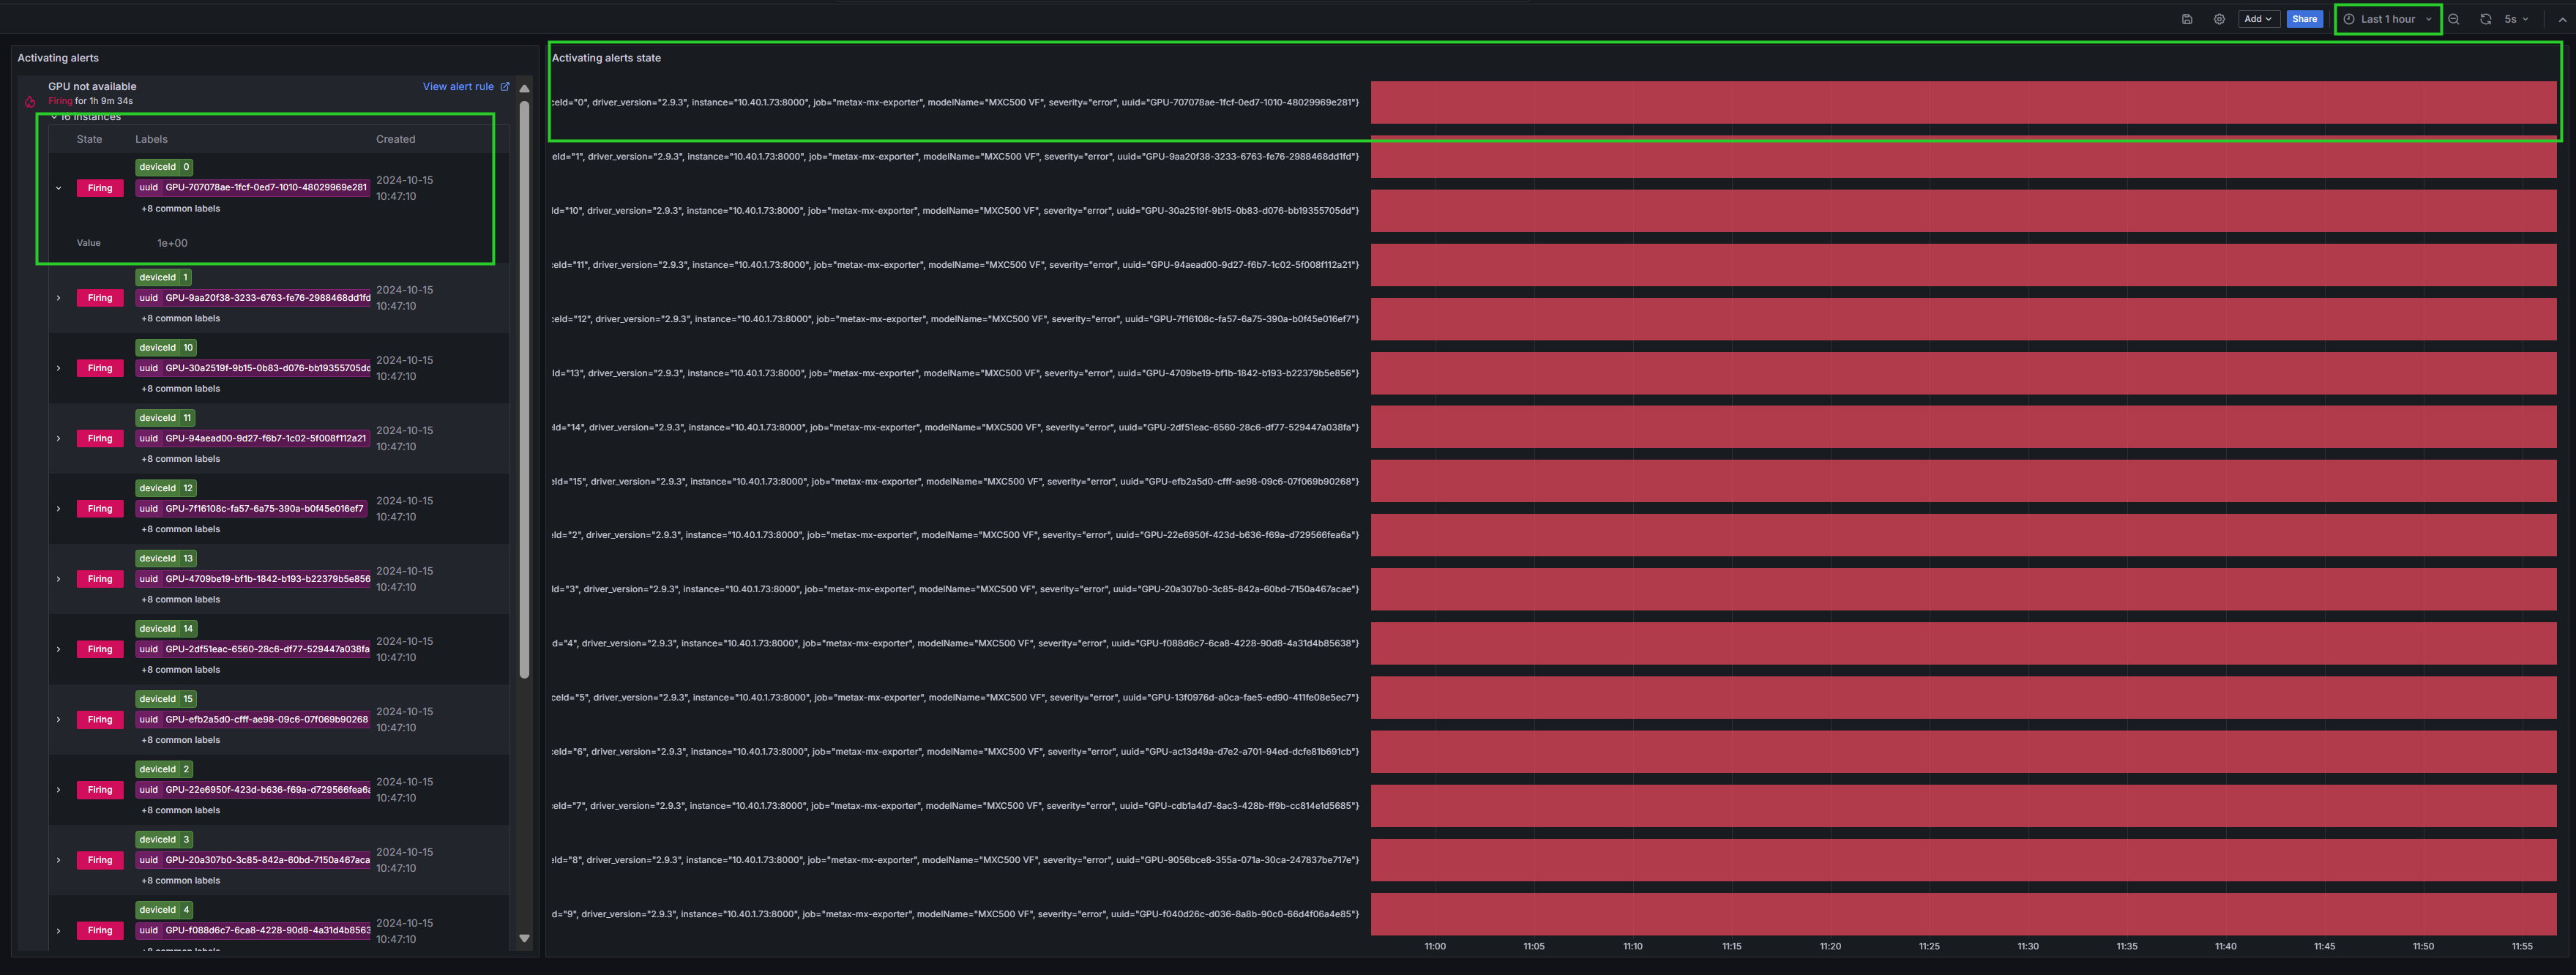
图 7.2 Grafana告警展示
点击图 7.2 中左边区域的右上角 View alert rule,可查看告警详细信息,如图 7.3 所示。
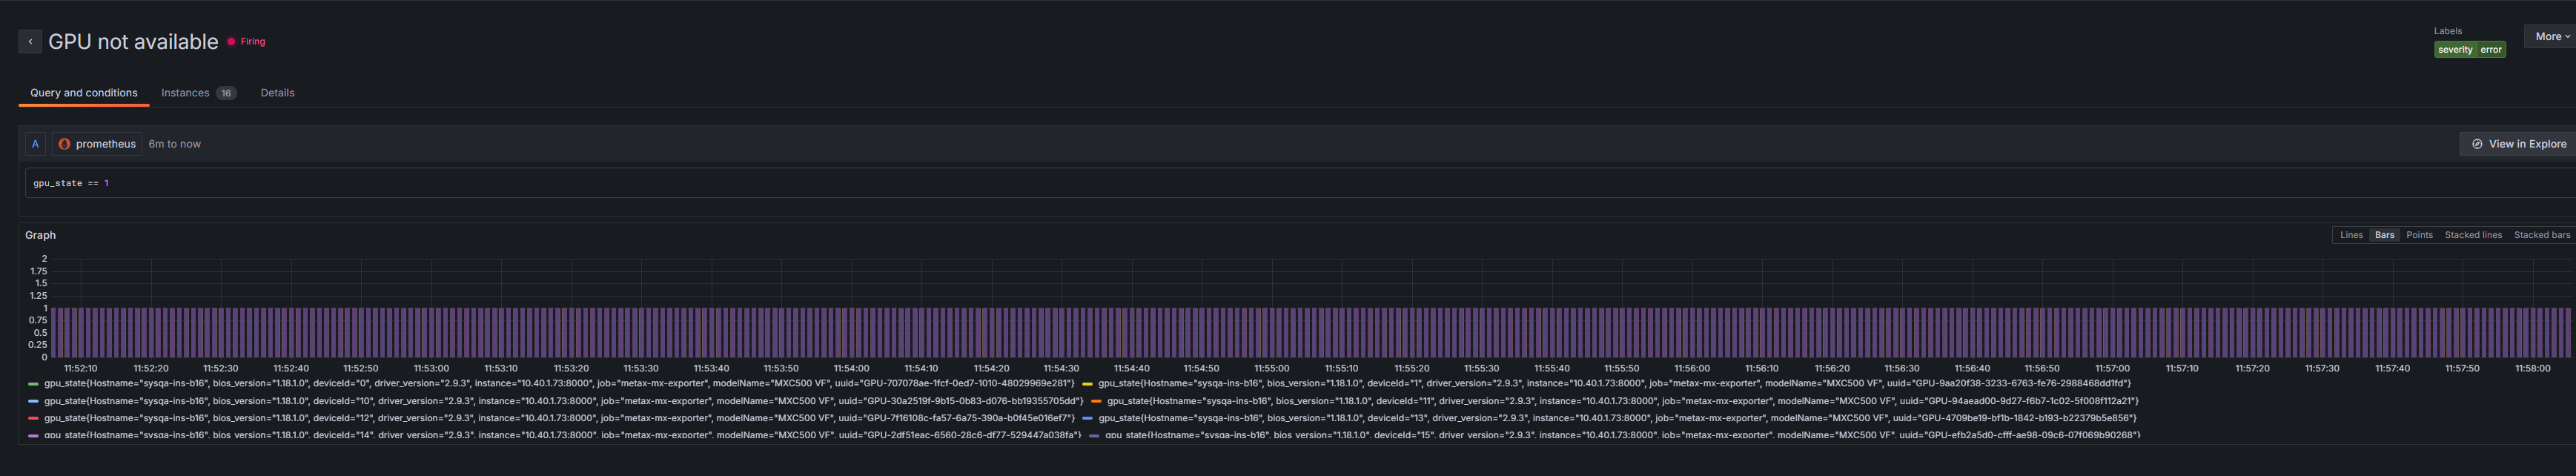
图 7.3 告警详细信息