你好,现在使用的mcTracer能打印出kernel的执行时间,但是无法打印kernel在硬件信息的执行流水,类似于数据搬运,kernel加载,kernel执行,这样对于性能优化分析很不友好,请教一下,是否有类似于nv compute的分析工具,可以对算子执行流水进行解析。谢谢。
jiangbin
- Members
- Joined 2025年8月5日
-
-
gitee.com/metax-maca/mxmaca-performance-tuning-guide/issues 已经提了,麻烦帮回复,谢谢。
-
-
-
-
-
-
相同的日志里面,server里面打印的模型执行信息:
*warning] cannot get rpc server port, try more times:cannot retrieve rpc server port.
mcToolsExtPid_UsedPort:11989-33853
mcRpcPort.ini: ['11989,33853,python3.10']
[info] mctool client port:33853*
INFO 08-07 15:52:12 [parallel_state.py:1004] rank 0 in world size 1 is assigned as DP rank 0, PP rank 0, TP rank 0
INFO 08-07 15:52:12 [cuda.py:204] Using FlashMLA backend on V1 engine.
WARNING 08-07 15:52:12 [topk_topp_sampler.py:69] FlashInfer is not available. Falling back to the PyTorch-native implementation of top-p & top-k sampling. For the best performance, please install FlashInfer.
INFO 08-07 15:52:13 [gpu_model_runner.py:1329] Starting to load model /home/weight/DeepSeek-V2-Lite...
Loading safetensors checkpoint shards: 0% Completed | 0/4 [00:00<?, ?it/s]
Loading safetensors checkpoint shards: 25% Completed | 1/4 [00:04<00:13, 4.48s/it]
Loading safetensors checkpoint shards: 50% Completed | 2/4 [00:07<00:07, 3.74s/it]
Loading safetensors checkpoint shards: 75% Completed | 3/4 [00:12<00:04, 4.24s/it]强调文本 -
Task Menu下面Ex cute Loop 0我这边看到的有在docker里面执行模型的命令,且模型执行成功。但是还是一样的报错。如果有防火墙,这个数据应该无法返回。我这边已经确认把gui-profiler加到百名店白名单里面
1.在server日志文件里面,我看到了模型推理过程日志以及结果的打印日志。mcRpcPort.ini: ['cat: /root/mcRpcPort.ini: No such file or directory']这个是需要手动修改还是需要额外启动RPC服务?如何启动
[warning] cannot get rpc server port, try more times:cannot retrieve rpc server port.
mcRpcPort.ini: ['cat: /root/mcRpcPort.ini: No such file or directory']
[warning] cannot get rpc server port, try more times:cannot retrieve rpc server port.
mcToolsExtPid_UsedPort:10466-46153
mcRpcPort.ini: ['10466,46153,python3.10']
[info] mctool client port:46153
INFO 08-07 15:32:15 [parallel_state.py:1004] rank 0 in world size 1 is assigned as DP rank 0, PP rank 0, TP rank 0
INFO 08-07 15:32:15 [cuda.py:204] Using FlashMLA backend on V1 engine.
WARNING 08-07 15:32:15 [topk_topp_sampler.py:69] FlashInfer is not available. Falling back to the PyTorch-native implementation of top-p & top-k sampling. For the best performance, please install FlashInfer.
INFO 08-07 15:32:16 [gpu_model_runner.py:1329] Starting to load model /home/weight/DeepSeek-V2-Lite...
Loading safetensors checkpoint shards: 0% Completed | 0/4 [00:00<?, ?it/s]
Loading safetensors checkpoint shards: 25% Completed | 1/4 [00:04<00:12, 4.27s/it]
Loading safetensors checkpoint shards: 50% Completed | 2/4 [00:07<00:07, 3.54s/it]
Loading safetensors checkpoint shards: 75% Completed | 3/4 [00:11<00:04, 4.02s/it]
[error] cannot connect to server:
[error] execute failed:
[error] Traceback (most recent call last):
File "prpc_client\mctool_client.py", line 36, in init
File "grpc_utilities.py", line 151, in result
File "grpc_utilities.py", line 97, in _block
grpc.FutureTimeoutError麻烦再帮看看,谢谢。3
-
感谢,应该是我理解错误,这里不需要选额外的docker选项了。还有一个问题请教,跑完以后,数据返回貌似失败。我这边请求已经跑完了。但是数据返回失败。
[warning] cannot get rpc server port, try more times:cannot retrieve rpc server port.
mcRpcPort.ini: ['cat: /root/mcRpcPort.ini: No such file or directory']
[warning] cannot get rpc server port, try more times:cannot retrieve rpc server port.
[error] cannot connect to server:
[error] execute failed:
[error] Traceback (most recent call last):
File "prpc_client\mctool_client.py", line 36, in init
File "grpc_utilities.py", line 151, in result
File "grpc_utilities.py", line 97, in _block
grpc.FutureTimeoutErrorDuring handling of the above exception, another exception occurred:
Traceback (most recent call last):
File "phttp\server_backend.py", line 649, in perf_exec
File "phttp\server_backend.py", line 566, in _perf_exec
File "phttp\server_backend.py", line 523, in perf_run
File "prpc_client\mctool_client.py", line 40, in init
Exception -
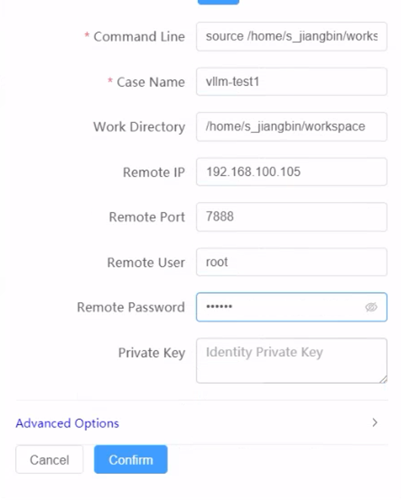
麻烦请教一下,使用docker的情况下。 remote port是不是映射到docker22上的linux端口。譬如8080->22 那填写的是8080?这里的remote user 和password是linux的还是docker的? 我目前用的都是docker的ip,username 和passwd,port是linux的映射端口。
看日志的话,有报错如下:2025-08-06 21:01:52,803 INFO paramiko.transport: Authentication (publickey) failed.
2025-08-06 21:01:52,803 DEBUG paramiko.transport: userauth is OK
2025-08-06 21:01:52,852 INFO paramiko.transport: Authentication (password) successful!
2025-08-06 21:01:52,880 DEBUG paramiko.transport: Debug msg: b'Ignored authorized keys: bad ownership or modes for file /root/.ssh/authorized_keys'
2025-08-06 21:01:52,959 DEBUG paramiko.transport: Dropping user packet because connection is dead.
2025-08-06 21:01:52,959 DEBUG paramiko.transport: Dropping user packet because connection is dead. 麻烦帮看看,谢谢。